Background
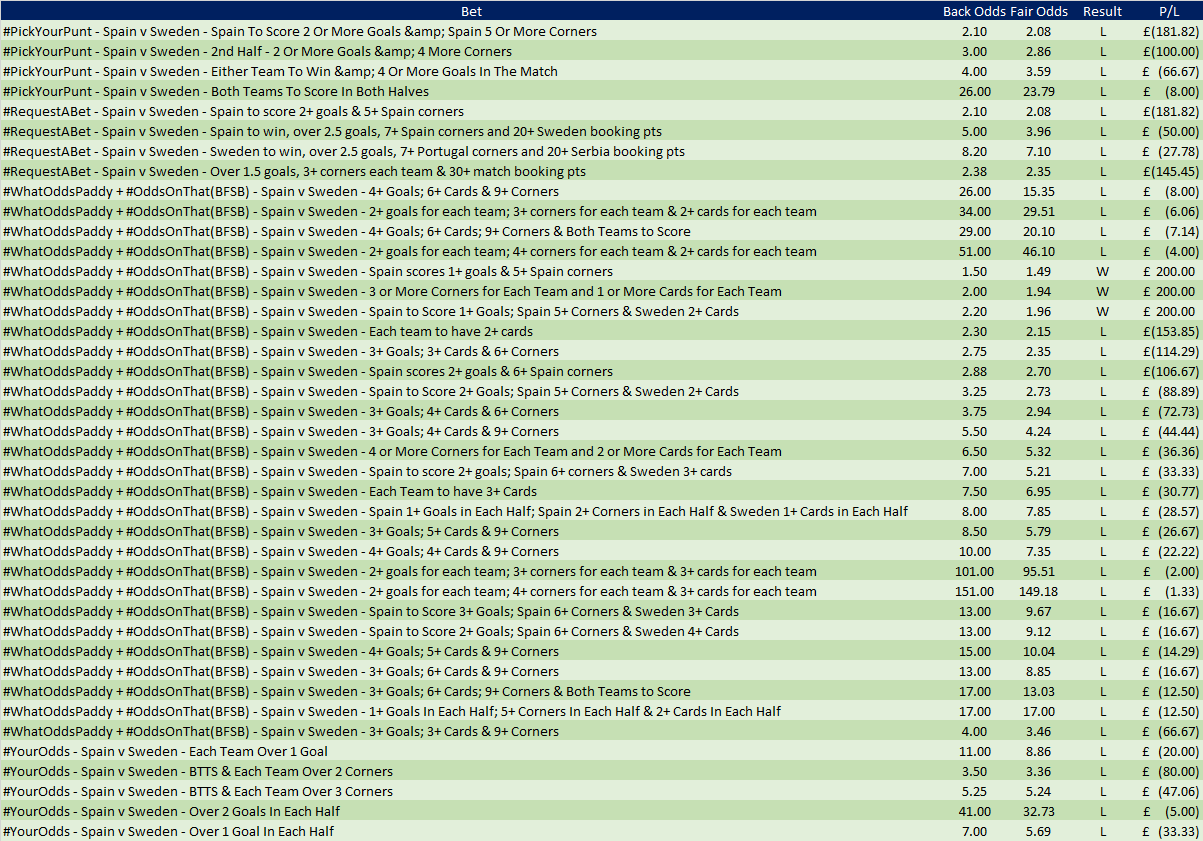
On Sunday night we were presented with 41 +EV bets in the Spain v Sweden game. These were the bets:
A question was then asked of us:
Are you (bookiebashing) just going to ignore all the purple Spain v Sweden bets?
So lets look into the purple Spain v Sweden bets:
- The reason 48 bets were +EV is there was a large discrepancy in expected goals, corners and cards between the bookmakers, spreads and the exchange.
- Since the same line is used throughout the bets at the bookmaker, a large set can all be +EV.
- When the discrepancy is large it is up to us as advantage players to decide whether the bookmakers have used a more accurate line, or whether the information at the exchange and the spreads is more reliable.
Level staking every bet
- Were we to bet every bet on the tracker with a level stake with £200 liability / bet then 38 of 41 bets would have lost for a net loss of -£1,295.76.
- It may be suggested that staking every bet in a game with a level stake is not an optimal strategy. On average there are 4.64 bets per game on the Combobets tracker. If we bet every bet to win the same liability then the volatility and variance will be at the mercy of the few games where 41+ bets are +EV.
- In the last 1000 games on the Combobets tracker only 2 matches have had more than 41 +EV bets – West Brom v Arsenal (25th August) and Italy v Lithuania (8th September).
Staking to win a level amount across the Match
- We can look at a strategy of betting to win a level liability across the sum of all bets in a match. In other words, we will win £200 on Spain v Sweden, and will weight the stakes all of the bets by a function of the odds to achieve this.
- Modelling this allows us to consider all bets, and would be representative in the long term of a user cherry picking any bet(s) at random from the 41 +EV bets available.
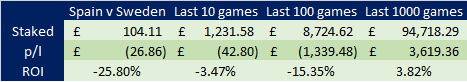
- With only 3 winning bets and 38 losing bets we still would have had a -26.9% ROI on the Spain v Sweden match.
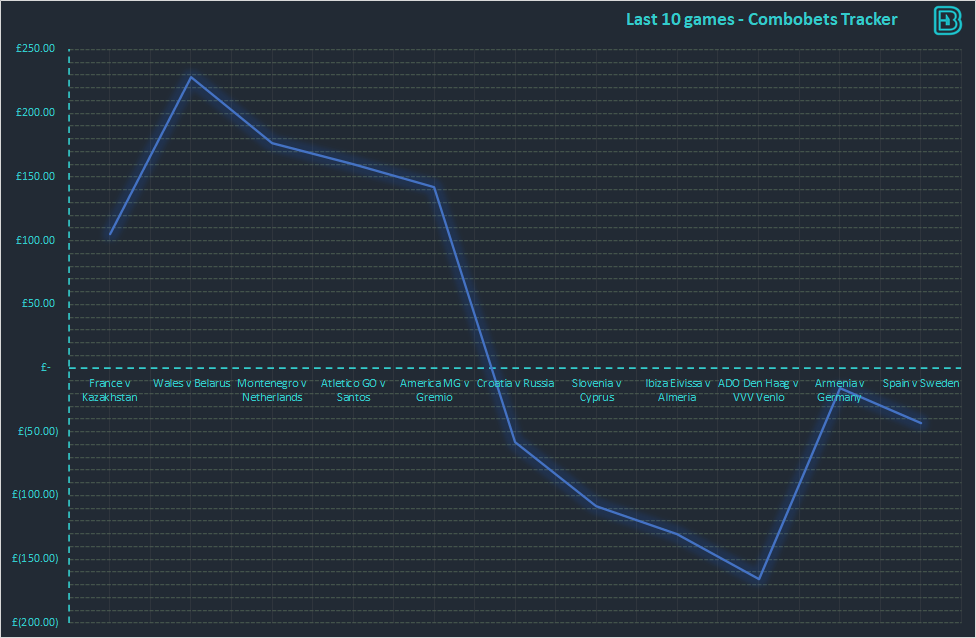
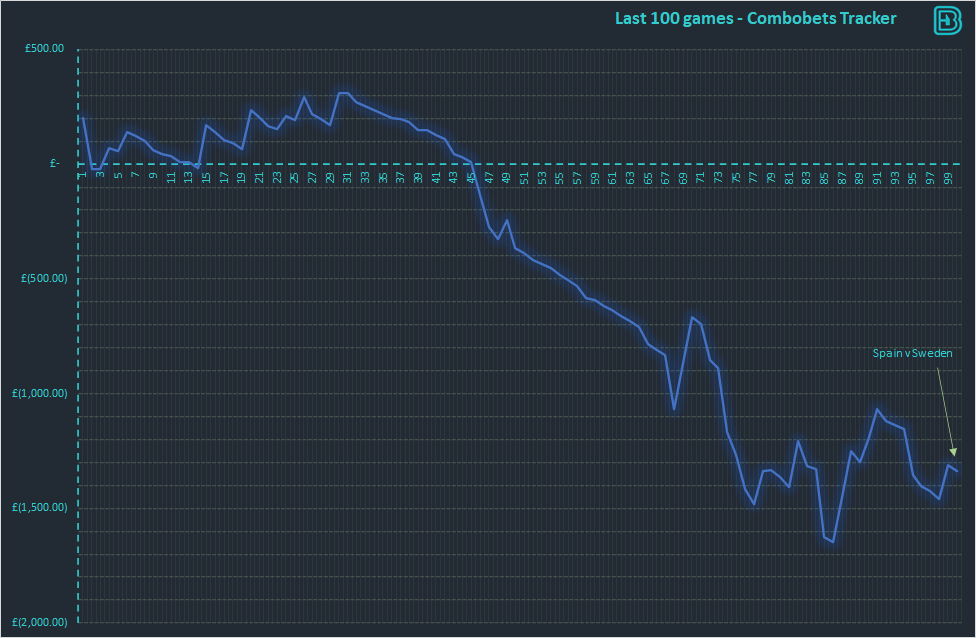
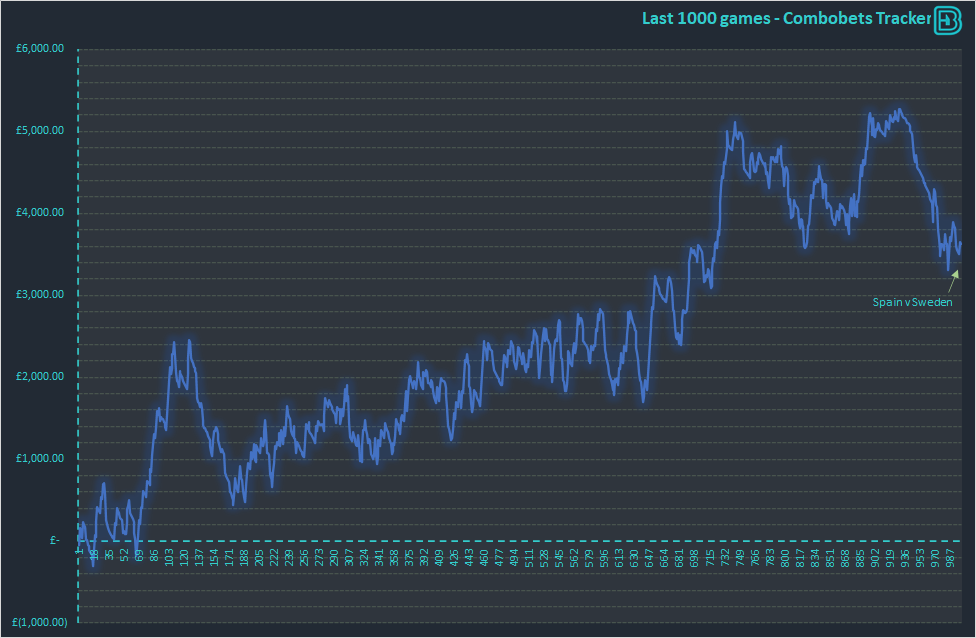
- The table and graphs below show how this stands up against the last 10, 100 and 1000 matches.