
The Corners Problem
Corners are not independent. A corner will often lead to another corner. They come in clusters. Poisson can be a useful model, but it is most precise when events that are being counted are independent and do not come in clusters.
This means that the observed chance of 0 corners is higher than poisson would assume, and the observed chance of an average number of corners is lower than poisson would assume. This is called underdisposition.
The graph below show historical data from 30,000 games in 900 leagues, with an average of 9.54 corners on avg. per game. The graph is overlaid with a prediction of corners using a mean of 9.54 under Poisson.
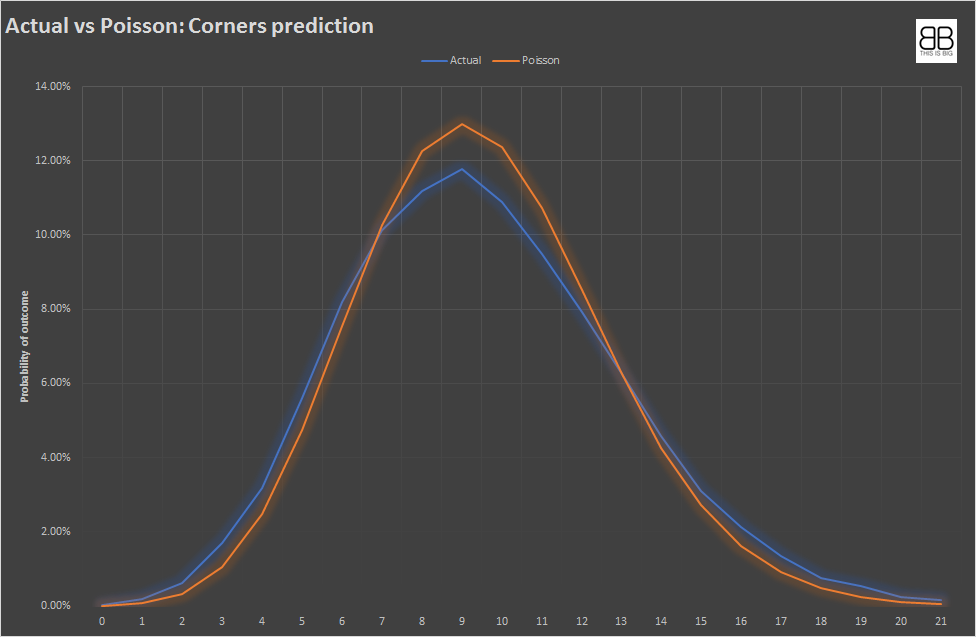
This is taken from looking at every game in 907 leagues/competitions in six months of 2019. Applying a Poisson distribution to this dataset will result in overestimating the likelihood of 0-6 corners and 13-22 corners, and underestimating the likelihood of 7-12 corners.
(One game had 22 corners this year; Budaorsi SC vs Dunakanyar Vac in the Hungarian NB II league on August 11th. Probably worth scouting for tickets for the reverse fixture)
We have built an adjusted discrete probability distribution to compensate for the incorrect shape of a Poisson distribution. This takes account of the underdisposition and flattens the curve so that our probability estimations are much closer to historical occurrences than Poisson. We used a Polynomial Regressional Analysis below to determine the co-efficients for Full Time Corners for combined teams.
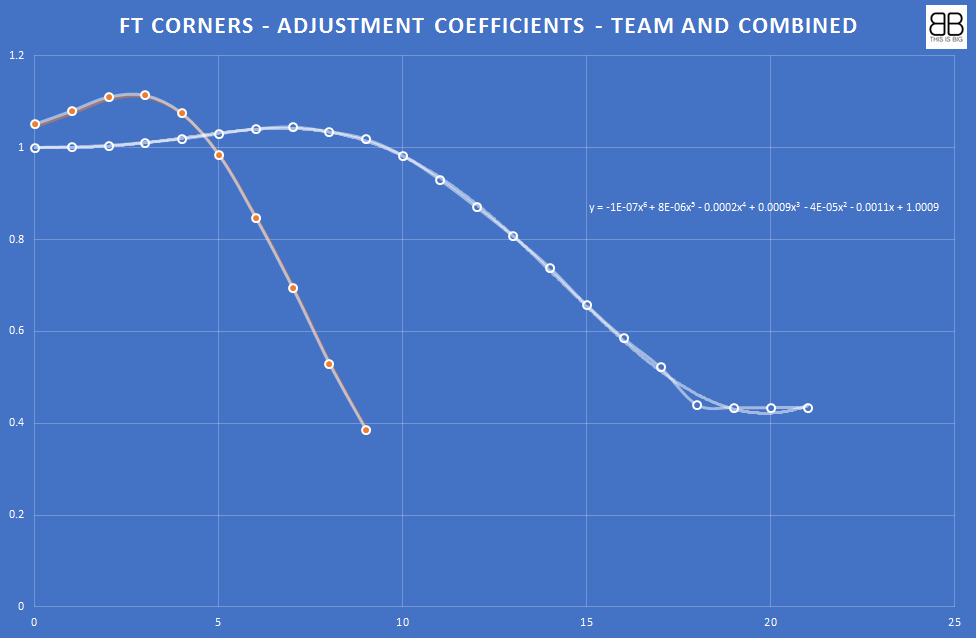
What this serves to do is give us a probability distribution that we think is much more reliable than Poisson. We have four separate Adjusted Probability Distribution models that we use. Team by Half, Combined by Half, Team by Full Time, Combined by Full Time.
The graph below shows a back testing of the model against historical data. It can be seen that the relationship is much closer to observed data than a Poisson distribution.