US Masters 2024 – Hole in One Market

Hole In One

Will there be a Hole in One at the Masters this year? This is the historical frequency:

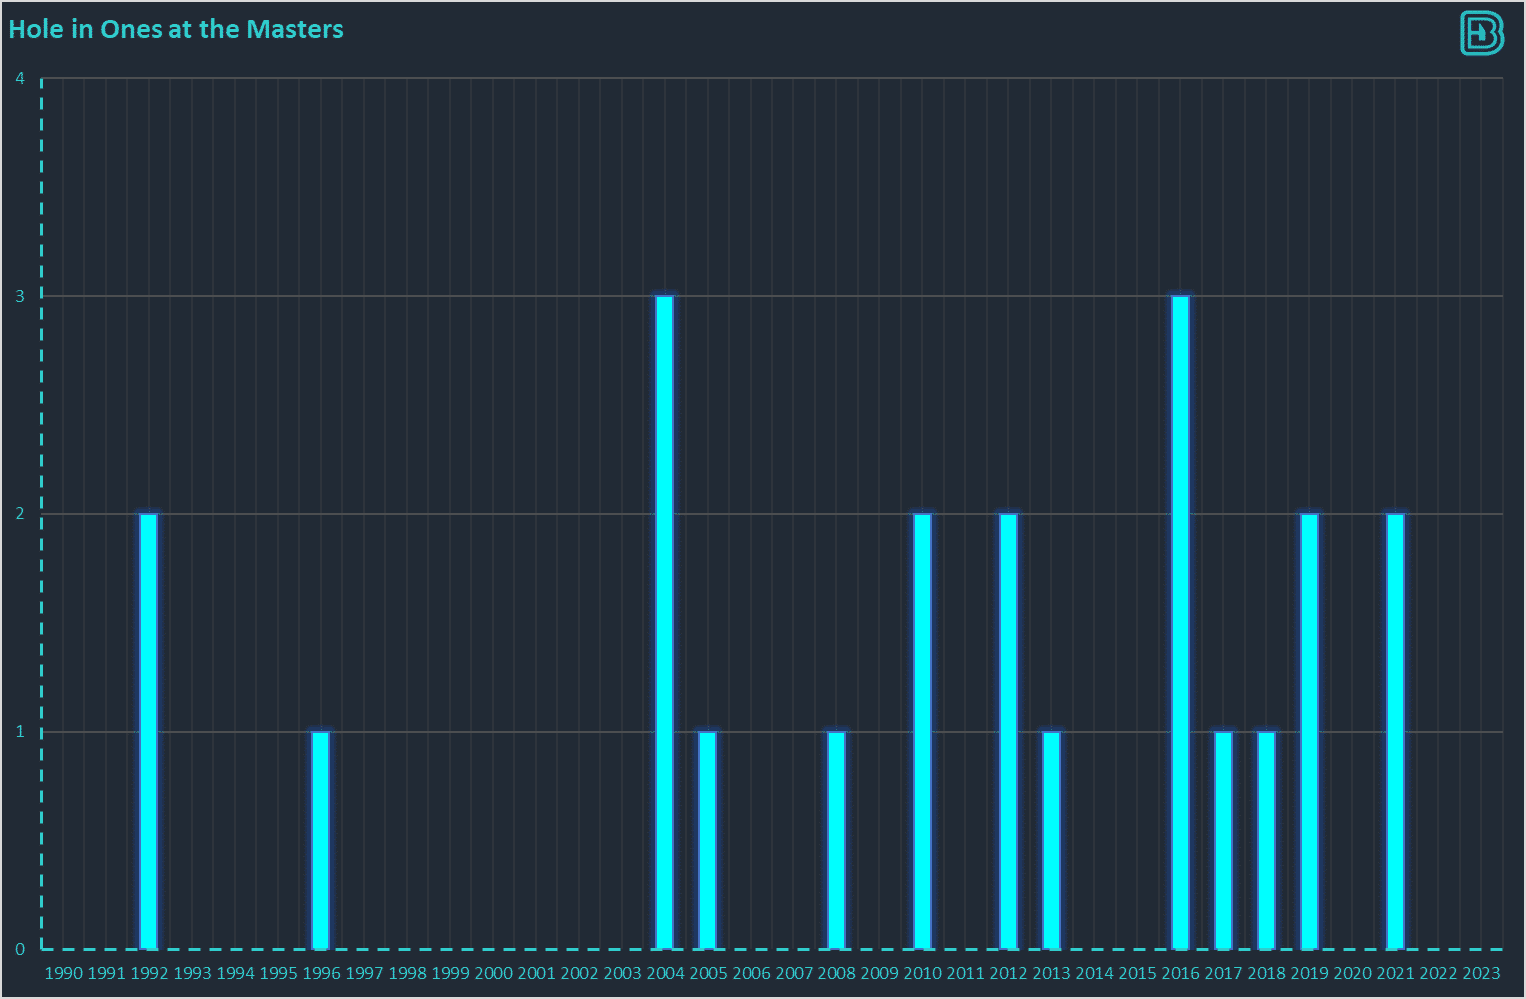
  • The average number of holes in one since 2010 has been 1 / year (14 in 14 years).
  • The average number of holes in one since 2000 has been 0.79 / year
  • The average number of holes in one since 1990 has been 0.68 / year


Data RangeHoles In One / YearYes (odds)No (Odds)
2010-20231.001.5822.718
2000-20230.791.8282.207
1990-20230.652.0991.910

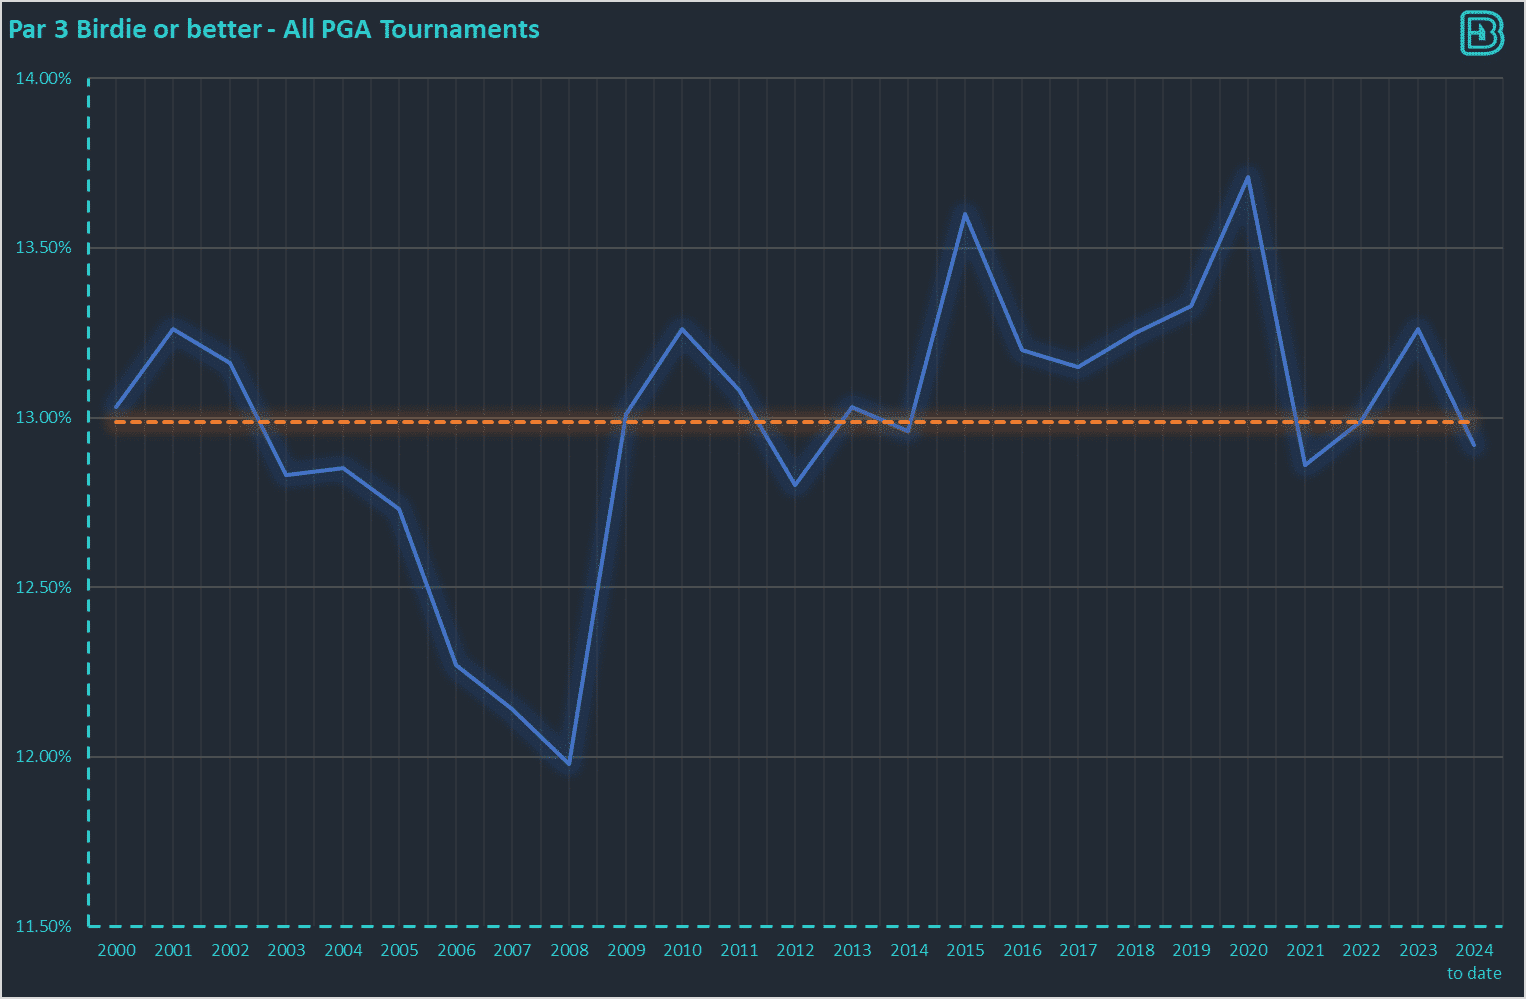
The data is only relevant if it is comparable – if nothing has changed over time, such as players getting better. at Par 3s. To check this we can look at player performance over time, specifically the Par 3 Birdie or Better stat from the PGA: 

“Yes Hole in One” is currently available to back at 1.33 to 1.5, so no value.

“No Hole in One” is currently available to back at 2.5-2.8, and this looks like value. The 3.25 at Skybet looks like a great price, and the exchange prices look good at the time of writing.  Personally I am looking to back anywhere over 2.4.

Each Way Edges

If you are going to bet on one golf tournament a year then pick the US Masters. 

As it is the first of the majors, the bookmakers offer lots of concessional value. In the past 5 places was standard.  These days there is a “Battle Of the Places” as bookmakers embark on one-upsmanship; at the time of writing, bet365, skybet, william hill and host of others are 8 places Each Way, Paddy Power, Coral, Ladbrokes and Betfred are 10 places and Betfair Sportsbook are 12 places.

The US Masters is an invitational tournament, and it is a smaller field than usual. Fields of 150-160 are common on the PGA and DP World Tour. The 2024 US Masters has a field of 89. In this field there are a bunch of “special invites” that cannot win. Fred Couples (64) and Vijay Singh (61) were once great, but will not be competitive this weekend. Therefore the field “with a chance of winning” is even smaller than usual, whilst the places paid are greater is larger than usual.

All of this means – we get more value in this tournament than any other.

Does this mean we have a historical profit on the US Masters? We have taken 5-9 players from our tracker, attempting to cover 10-15% of the field, and have tracked their ROI. Note this table is just for fun – a sample size of four tournaments is statistically irrelevant.

TournamentPlayersStakedp/lROI
US Masters 20205£152.00-£59.20-38.95%
US Masters 20218£178.00£77.8043.71%
US Masters 20229£178.00-£43.00-24.16%
US Masters 20238£190.00£72.3538.08%

In terms of the other majors, the overall ROI is 45.62% (again, the sample size of 17 tournaments is statistically irrelevant). This is slightly higher than our long term ROI of 32% on the golf tracker (results here) 

MajorStakedp/lROI
The Open£634.00£595.6093.94%
US Masters£698.00£47.956.87%
US Open£990.74-£68.34-6.90%
USPGA£690.00£799.17115.82%
All Majors (2019-2023)£3012.74£1374.3845.62%

A breakdown of each individual major shows how much each can swing depending on whether we get a place, a couple of places or the winner:

TournamentPlayersStakedp/lROI
Open Championship 202010£102.00-£38.00-37.25%
Open Championship 20218£178.00£362.80203.82%
Open Championship 20228£180.00£444.80247.11%
Open Championship 20238£174.00-£174.00-100.00%
US Open 201913£252.74£51.2620.28%
US Open 20209£182.00£138.4076.04%
US Open 202110£206.00-£116.00-56.31%
US Open 20227£202.00-£90.00-44.55%
US Open 20238£148.00-£52.00-35.14%
USPGA Champoinship 201913£238.00£758.50318.70%
USPGA Championship 20218£140.00-£8.33-5.95%
USPGA Championship 20228£176.00£137.0077.84%
USPGA Championship 20238£136.00-£88.00-64.71%