
What Is It?
The Steamers Tool helps you cut through the noise of betting markets by automatically identifying when momentum is building behind a price move. Instead of manually checking odds across different timeframes, the tool highlights where there is clear market confidence — whether that’s a price steaming in (shortening) or drifting out (lengthening). By surfacing these trends in real time, it saves time and ensures you don’t miss out on significant market moves.
This makes the tool especially useful for anyone who wants to stay ahead of the curve in betting markets. Whether you’re looking to catch the early signs of strong support for a selection, avoid backing something that is rapidly weakening, or simply get a better sense of market sentiment, the tool provides straightforward, actionable signals.
FAQ
What sources are used?
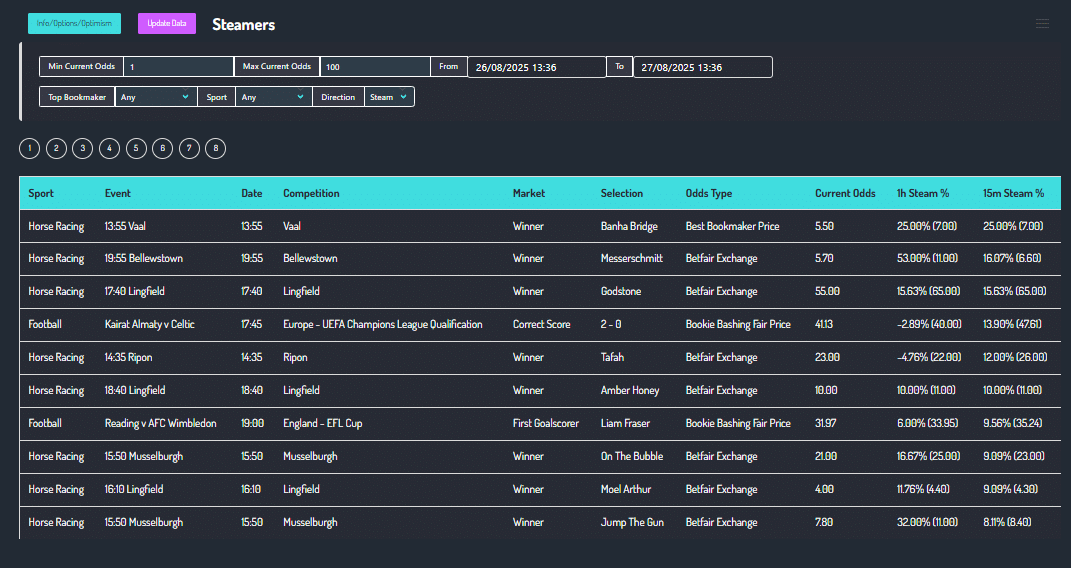
Prices are taken from 3 different sources. The “Odds Type” column shows the source used for each row (e.g., Best Bookmaker Price, Betfair Exchange, Bookie Bashing Fair Price).
What do you classify as a steamer?
A selection is classified as a Steamer when the most recent price history shows three consecutive decreases (odds shortening) within the past 60 minutes.
What do you classify as a drifter?
A selection is classified as a Drifter when the most recent price history shows three consecutive increases (odds lengthening) within the past 60 minutes.
How often are prices of selections logged?
Prices are captured at regular intervals throughout the day and stored as a time series for each selection and market, enabling review over any From/To window in the interface.
The sampling cadence speeds up as the scheduled start approaches to better capture late market moves.
How are reversals handled?
If the direction flips before three consecutive moves are recorded, we take a look at the polynomial regression of the points and attempt to predict which way it will go.
What do the “1h Steam %” and “15m Steam %” columns mean?
They show the percentage change between the current price and the price one hour ago (1h) or 15 minutes ago (15m). Positive values indicate drifting (price higher); negative values indicate steaming (price lower). The reference price is shown in parentheses.
Can I filter by direction, odds range, sport, or date?
Yes. Use the Direction filter (Steam/Drift), Min/Max Current Odds, Sport/Market filters, and From/To date-time pickers at the top of the page. Pagination controls appear beneath the filters.
Which odds are used for “Current Odds”?
The latest normalised price from the source shown in the “Odds Type” column for that row.
Does a signal imply value or an edge?
No. Signals indicate momentum only.