

Player Stats Exchange Results: An Early Look at 4,396 +EV Opportunities
We have had repeated requests from members to publish more detailed results from the Player Stats and Player xG models from the start of the 26/27 season, so we have decided to release this analysis earlier than we ordinarily would.
That comes with an important caveat: we would prefer a much larger sample before drawing strong conclusions.
The dataset currently contains 4,396 qualifying opportunities above 100% EV after commission, covering 84 matches between 8 September and 15 October 2026.
Four thousand bets sounds like a huge sample. In reality, for the type of analysis we are doing, it still isn’t particularly large.
Many of the bets are related to the same matches, players and underlying events. A single goal, card or shot can affect several markets at once, so 4,396 bets should not be thought of as 4,396 completely independent observations. We would be much happier assessing the model after something closer to 20,000 lines, particularly when breaking performance down into individual markets, odds ranges and EV bands.
Why publish now?
Quite simply, because members keep asking us to.
There is also an unavoidable selection bias in the feedback we receive. When somebody is winning steadily, they rarely contact Support to tell us that everything is working exactly as expected. When somebody suffers a losing run, understandably, they are much more likely to ask whether something is wrong.
We know of many members currently making money from these markets. As one recent example, a coaching client who had previously not been betting Player Stats told me he made around £1,800 from them last weekend.
That is obviously anecdotal and isn’t evidence of model performance. The evidence has to come from the data itself. But it illustrates why individual experiences can give a distorted impression in either direction.
The results so far
Using every qualifying selection above 100% EV after commission:
| Bets | Amount risked | P/L | ROI | |
|---|---|---|---|---|
| All bets | 4,396 | £146,039.53 | +£2,098.30 | +1.44% |
| Backs | 1,121 | £6,038.93 | +£540.65 | +8.95% |
| Lays | 3,275 | £140,000.60 | +£1,557.65 | +1.11% |
Both the back and lay sides are currently profitable.
The much larger amount risked on lays is simply a consequence of using lay liability rather than the amount available to win.
Performance by market
| Market | Bets | Amount risked | P/L | ROI |
|---|---|---|---|---|
| First Goalscorer | 964 | £34,258.23 | +£646.28 | +1.89% |
| Anytime Goalscorer | 884 | £20,174.52 | +£316.82 | +1.57% |
| 1+ SOT | 903 | £14,061.23 | +£157.43 | +1.12% |
| 2+ SOT | 561 | £24,604.48 | +£255.03 | +1.04% |
| Cards | 554 | £17,633.11 | +£922.21 | +5.23% |
| 2+ Goals | 285 | £16,267.43 | -£227.43 | -1.40% |
| 3+ Goals | 245 | £19,040.53 | +£27.96 | +0.15% |
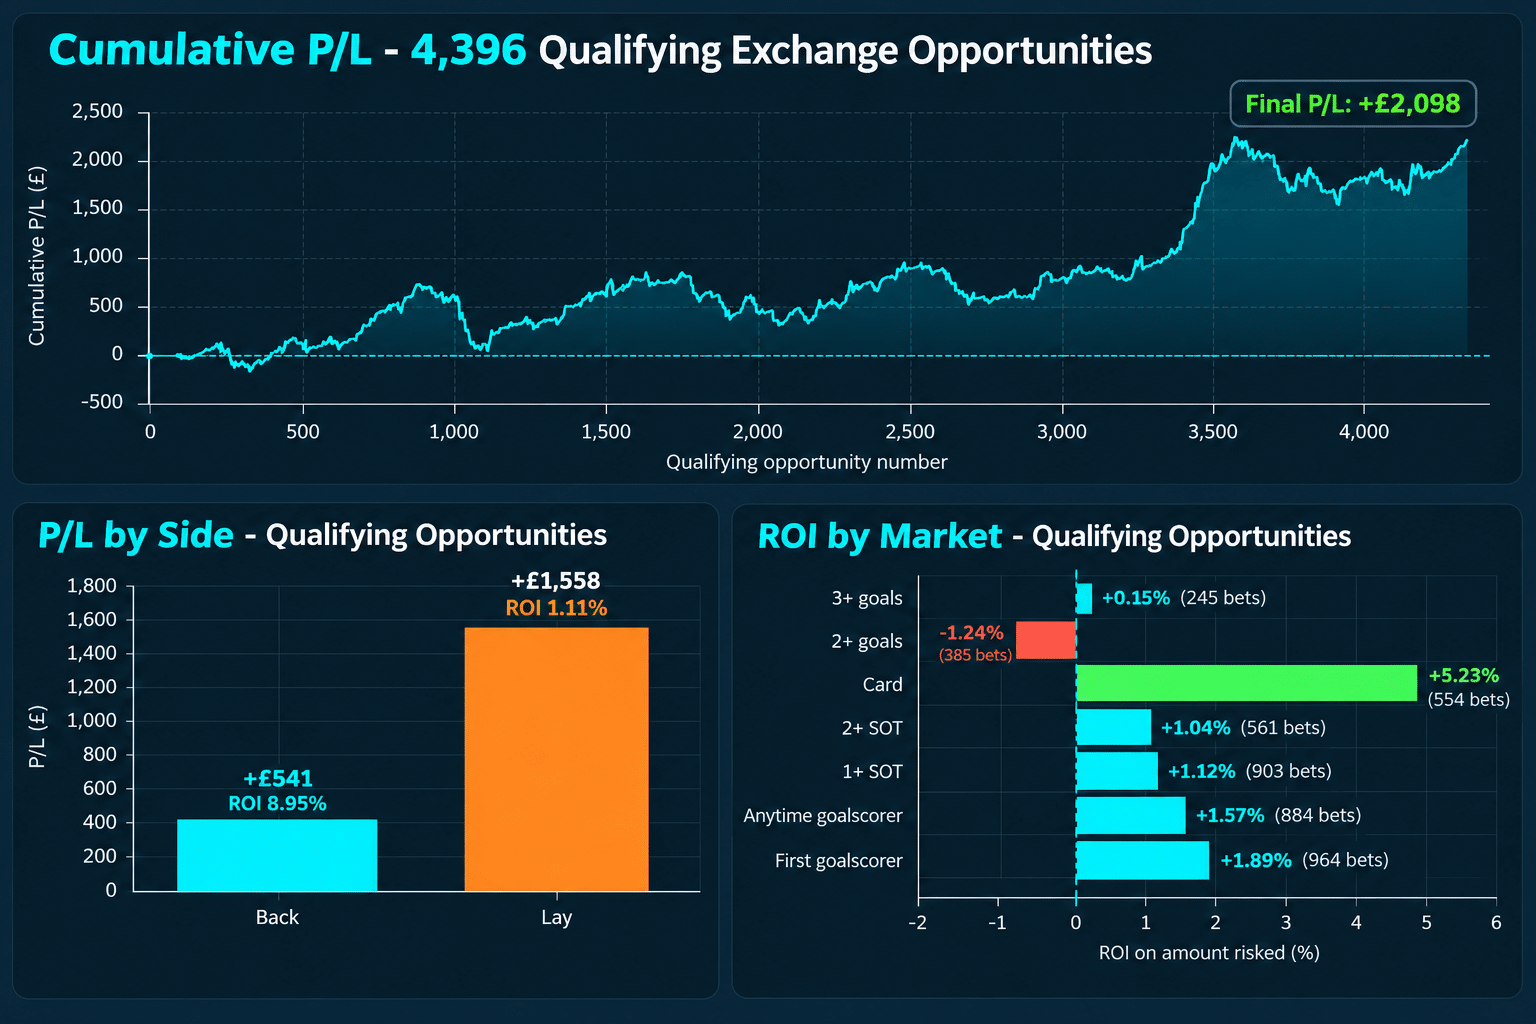
Six of the seven broad market groups are currently profitable.
The obvious exception is 2+ goals, which is currently down £227.43. We have no intention of hiding that. In fact, this is exactly why we are cautious about drawing conclusions from relatively small subsets. Once 4,396 bets are split by market, side, odds and EV, the individual samples become much smaller very quickly.
The cumulative results also show how uneven the journey has been. The dataset has experienced a drawdown of approximately £818 from a previous peak, despite ultimately reaching more than £2,000 profit. That is the reality of betting variance and one of the reasons short-term results can be misleading.
Are we confident in the underlying data?
Yes.
The models themselves are not new or untested. Our player expectancies are continually calibrated against very large historical datasets, in some cases running into hundreds of thousands of lines, and we benchmark our fair prices against the market at close.
What is new is this particular dataset of executable exchange comparisons.
We would therefore distinguish between two things:
Confidence in the underlying model and calibration is high. Confidence that 4,396 exchange bets tells us precisely what the long-term ROI will be is much lower.
The current data is encouraging. It is profitable overall, profitable on both backs and lays, and profitable across most of the major market groups.
But we would still rather have 20,000 observations than 4,396 before making stronger statements about expected long-term returns.
There is no need for us to hide from that distinction.
A note on result allocation
There is another practical limitation worth being completely transparent about.
The allocation of thousands of individual player results involves manual work and is inherently capable of small errors.
Even the underlying results providers are not completely static. A card or other event can initially be attributed to one player and then retrospectively reassigned to another after review.
We aim for at least 99% accuracy in the results dataset and will always correct anything that is brought to our attention. However, expecting absolute 100% accuracy across thousands of manually settled player markets is not realistic.
If you identify an incorrect result, please send us the match, player and market and we will check it.
The important measure is whether any small number of allocation errors is capable of changing the overall conclusion. Across thousands of bets, it should not be. Any misallocated result is equally likely to apply to a winner as to a loser.
Conclusion
We are publishing these results now because members have repeatedly asked to see them, not because we believe the sample is complete.
At the time of writing, 4,396 qualifying exchange opportunities have returned +£2,098.30 at an ROI of +1.44% on the amount risked.
That is encouraging.
It is not enough for us to declare that every market is proven, nor would we expect every member’s personal results to reproduce the aggregate dataset over a short period.
We will continue adding to the sample, monitoring the closing-line performance and publishing updates as the dataset grows.
The models have to be accountable to the numbers.
So far, the numbers remain profitable.