Background
Bookmakers offer prices on the winner of professional golf tour events along with a myriad of different each way place terms. These typically range from 5 places (1/4) up to 10 places (1/5).
The screenshot below shows bookmakers offering terms between 5 places (1/4) and 7 places (1/5) in the BMW Championship.

We calculate the EV of each golfer under each set of terms by estimating the gain attained by the additional places offered. Every time we click on the tracker, the model re-calculates the EV of every golfer at every bookmaker and ranks them by most favourable. The EV calculation uses the following approximation:
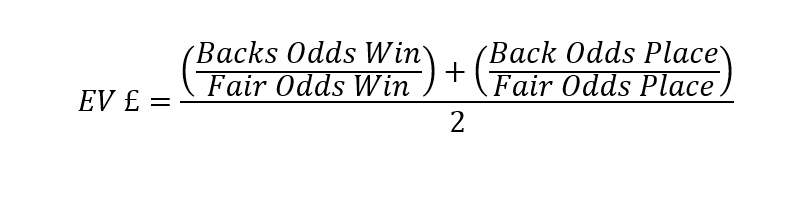
Back Odds Win and Back Odds Place – Value comes from the place
The back odds for the win come from the bookmakers. The place odds are either 1/4 (if you’re lucky) or 1/5. A few years ago 1/4 was commonplace but the trend has been to offer more places and worse terms – this makes it harder for arbitrage players to hedge their bets.
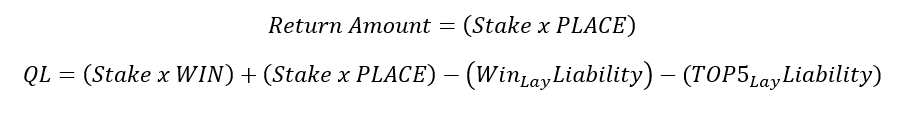
Our model is based on the determination of the value offered by the additional places. To determine the benefit of the additional places we can assume the win and Top 5 places are hedged. By hedging the bet we will have a qualifying loss (equal to the amount backed minus the amount recouped from laying) and a return amount (the amount returned for our player to finish in any place position).
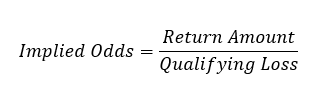
This assumption allows us to isolate the additional value provided by the concessionary places. The ratio of the Qualifying Loss against the Return amount is the Implied Odds of each player.
Fair Odds – An estimation of the probability of the golfer finishing in n-5 extra places
![]()
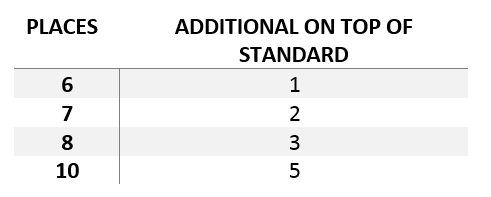
With 6 extra places, we have 1 additional place over the standard terms. With 7 places, we have 2 additional places, with 8 we have 3 and with 10 places we have 5 additional places of the standard terms.
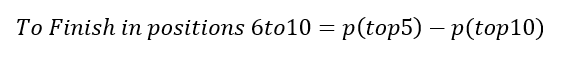
We can calculate the odds of 6th-10th by subtracting the estimated probability of finishing Top 10 from the estimated probability of finishing Top 5.
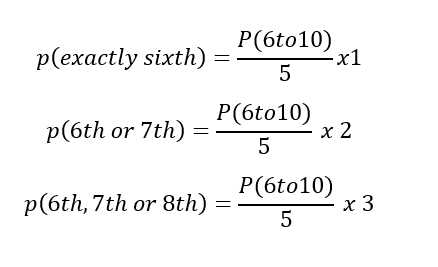
We assume a player is equally likely to finish 6th as 7th, 8th, 9th or 10th. This will be true for the majority of the field; however the relationship may break down for very short priced favourites. During the heyday of Tigers superiority, he was as low as 4/1 to win 100+ player tournaments, and was more likely to finish 6th than 10th. We do not currently have a player as dominant as Tiger on the tour, and therefore assume a linear relationship for all other players.
Overall:
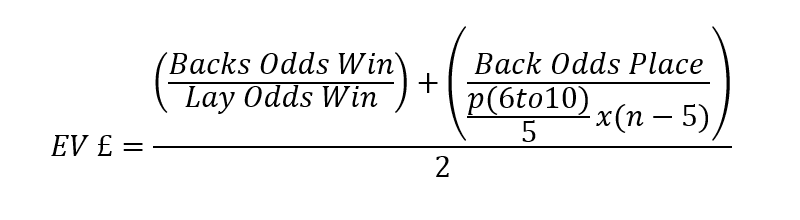
where n = the number of paid places.
For the purpose of these calculations, dead heats are ignored; they have no effect on expected value because in dead heats both the back and lay liabilities are reduced equally.
Estimating p(top 10) and p(top 5)
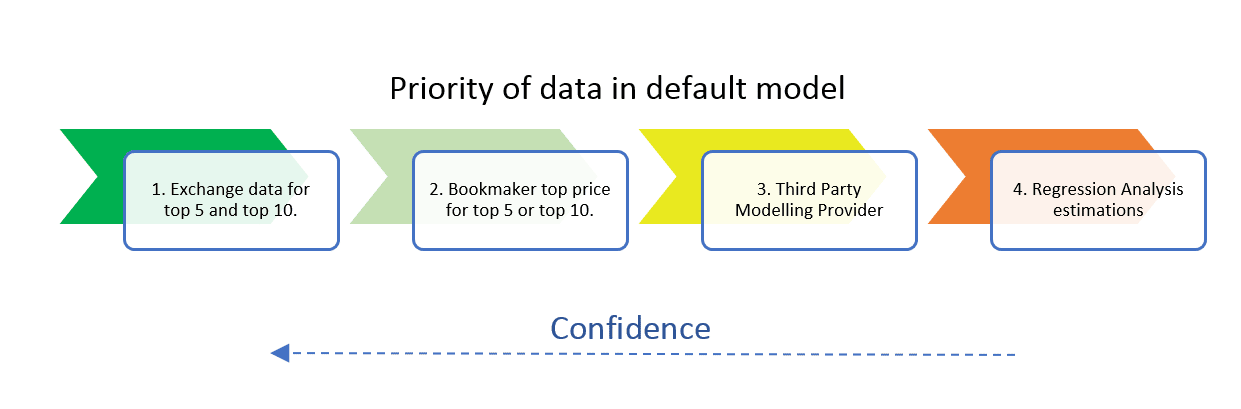
We use four methods for estimating the probability of top 5 and top 10. There is a hierarchy of confidence associated with each method, however data is not readily available for all data sets at any time. The default model will choose to use the available method with the highest confidence.
Exchange data for top 5 and top 10.
A liquid exchange will form a price through the wisdom of the crowds. We can use the available (a) lay price, (b) the Last Traded Price or (c) Middle of the Gap between the available back and lay prices. An algorithm assesses the liquidity and movement in the exchange to determine which of these three prices to use.
Bookmaker top price for top 5 and top 10.
We can use the bookmaker’s own prices to estimate a price for Top 5 or Top 10. We use a scraping model to assess the top price amongst all bookmakers for Top 5 and Top 10. Usually top price is very close to a realistic price, however to maintain pessimism we apply a markup based on the standard deviation from the 2nd top price and the number of bookmakers priced up.
Third Party Modelling Provider
We use probabilistic data provided by a third party that assesses fairway driving accuracy, greens in regulation, putting accuracy and a pairwise comparison between each player and their competitor in the field. The model has a benefit that it is not affected by the biases of a betting market.
Regression Analysis estimations
We have used a sample size of thousands of players to model the Top 5 and Top 10 prices based on their Exchange Win price using Regression Analysis. Individual relationships have been generated based on field size, composition, the price of the favourite(s) and the number of outsiders.
Information is not always available at the exchange, or at the bookmaker, or even from a third party, which is why they hierarchy is used. If all four sets of information are available, then the user may select any model they desire to rank the value. We recommend the use of the default model, which prioritises the information as such:
Example of the Tracker
The screenshot below provides an example of the tracker ahead of the BMW International. The top player is the best bet available (under our model this is Ian Poulter at 60/1). The EV column is highlighted. EV is capped at 999%, and players with the same EV are ranked by magnitude of odds from lowest to highest.
The tracker is designed for you to place bets on players at EV and odds of your choosing. The minimum EV and minimum odds you may want to bet at will depend on your risk tolerance. For example, you may choose to only bet on players under 200/1 unless they have an EV over 500%.