In a previous blog we looked at the application of a Poisson probability distribution to predicting Shots on Target in a game: https://www.bookiebashing.net/2022/09/08/shots-on-target-and-poisson/
We applied the same empirical analysis to goalscorers and we did not determine the same fit between a modelling expectation and recorded goals. See the graph below for a prediction of the number of goals Wayne Rooney would score in a game, based off his average of 0.4297 goals per game and a normal Poisson probability distribution:
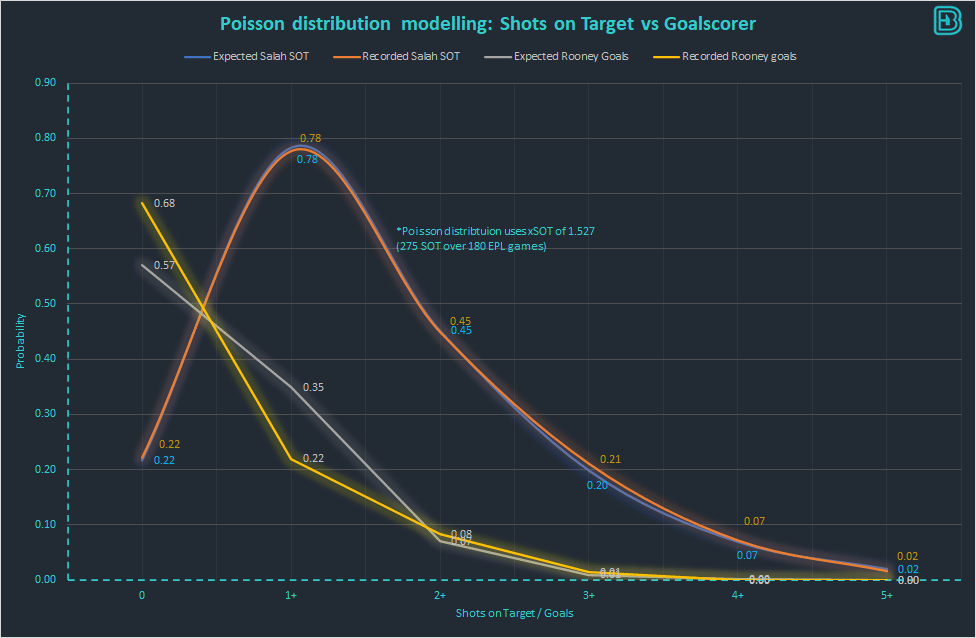
The Poisson distribution overestimated the number of times Rooney got a single goal and underestimated the number of times he got 2+ (34.2 vs his recorded 41) and 3+ (4.7 vs his recorded 7).
There may be tangible reasons for underdisposition of the Poisson model in multiple player goals, for reasons such as sample sizing, dominance and substitute frequency.
To determine the rate of underdisposition we undertook an empirical study of a Poisson distribution model predicting 2+ and 3+ goals for the top 40 historical Premier League goalscorers:
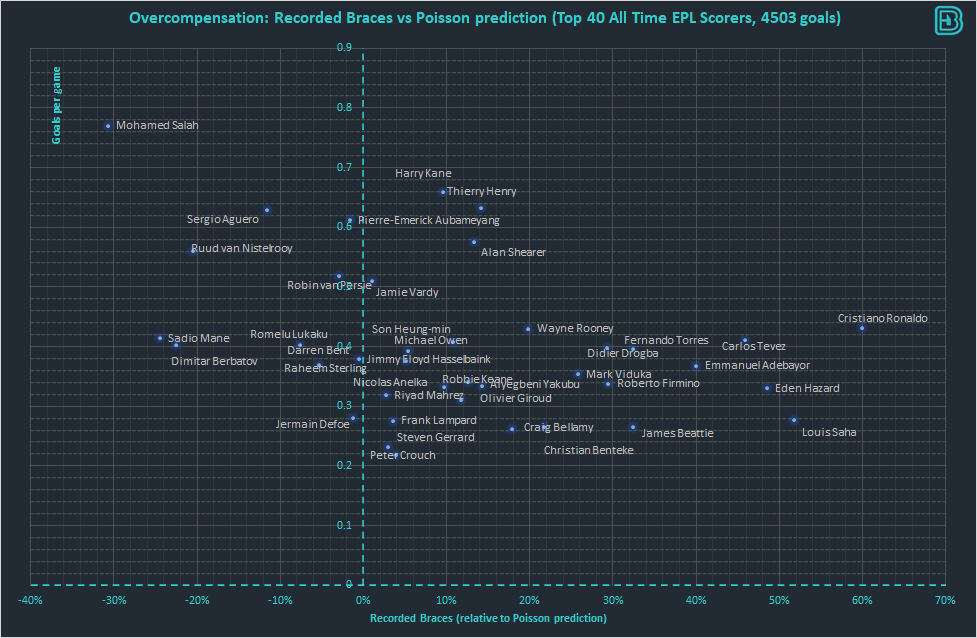
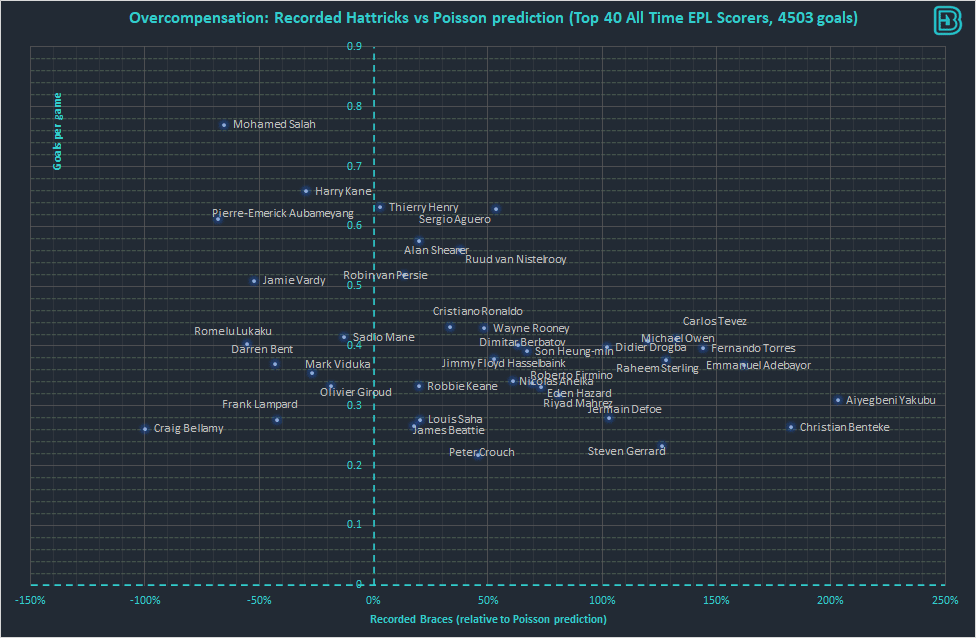
The analysis above shows that a Poisson distribution is pessimistic in approximately 75% of the players in both 2+ and 3+ samples. The average pessimism in 2+ is approximately 15% and the average pessimism in 3+ is approximately 50%.
Erling Haaland vs Southampton 8th October 2021
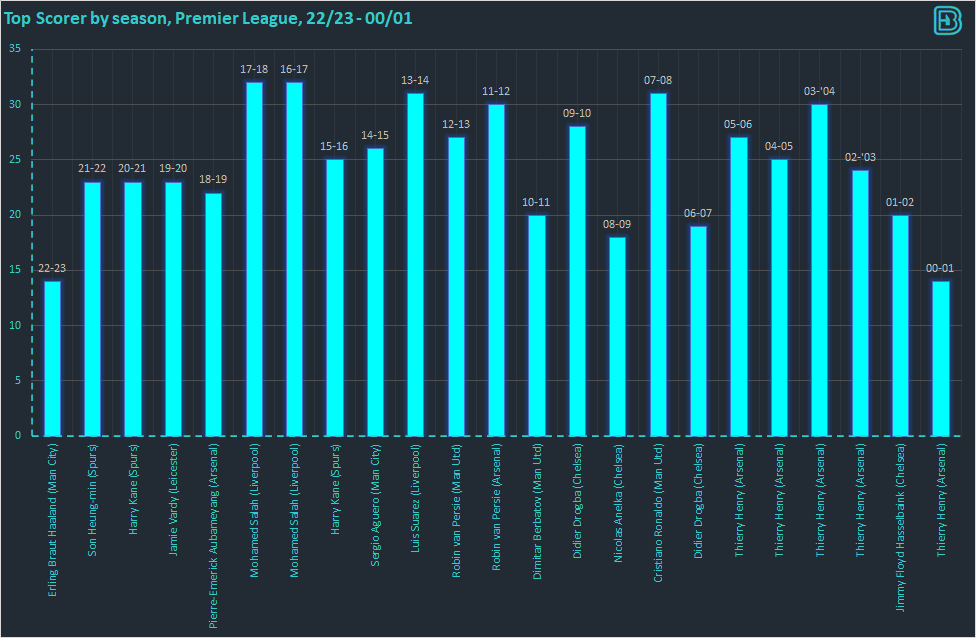
Erling Haaland is an outlier in footballing and statistical terms. The graph below shows top scorer by season. Note that Erling Haalands figures have been taken on the 8th October 2022 – barely 2 months into his 22/23 season. We are going to need a bigger axis come May 2023.
Erling Haaland is trading at 1.47 Anytime goalscorer on the exchange vs Southampton on 8th October 2022. Assuming the exchange is an accruate prediction of his true probability, 1.47 AGS is equivalent to an xG of 1.14. A normal Poisson distribution with a mean of 1.14 returns odds of 3.15 for 2+ and 9.2 for 3+.
These figures appear to be pessimistic when looking at the exchange traded prices for 2+ and 3+. We would expect this based on the underdisposition of Poisson calculated in the analysis above.
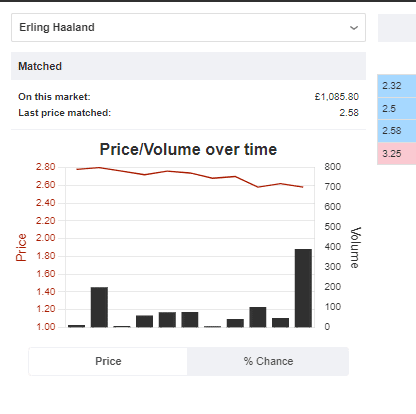
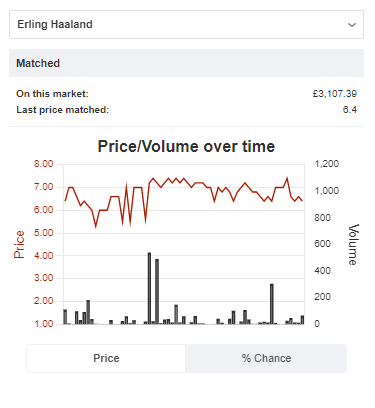
By adjusting the Poisson distribution to account for the underdisposition determined in the emprical analysis above, we adjust our calculations to 2.77 for 2+ and 6.44 for 3+.
Changes to the Player xG Model
At bookiebashing we will adjust our Player xG model according to account for the underdisposition discussed above. The model adjustments will take place at 2+, 3+, 4+, 5+, 6+ and 7+ goals. After 7+ we are unlikely to find value in any calculation, unless FIFA decide that Australia need to play American Samoa again.