How to Beat Exchange Prices with Your Own Football Model: A World Cup Case Study

Introduction

“The exchange is always right.”

It’s one of the most common phrases you’ll hear in betting circles.

For good reason too. Exchange markets are typically far more efficient than traditional bookmakers because prices are driven by thousands of people willing to back and lay against one another. By kick-off, many bettors treat the exchange closing line as the closest thing you’ll find to the “true” price.

A generation of arbitrage players has been raised to believe that the exchange price represents the Wisdom of the Crowds, and that this Wisdom is so Wise that an individual cannot out-perform it.

Is this true for every market, in the dwindling liquidity year of 2026? What if you didn’t have to accept those prices as necessarily efficient? Indeed, what if you can prove that they can be beaten?

What if you could build your own probabilities, compare them with the exchange and identify opportunities where the market had simply got it wrong?

That has been the objective of our football player models at BookieBashing for over a decade, but you don’t need sophisticated software to beat the exchanges.

Throughout the 2026 World Cup we independently priced every player for Anytime Goalscorer and First Goalscorer, before comparing those prices with the exchange closing line. Rather than selecting individual examples after the event, every qualifying player across the tournament was included in our analysis.

The purpose of this article isn’t simply to show a profitable graph.

The betting industry has had decades of scams, exaggerated marketing, fake tipsters, manipulated records and unrealistic claims. As a result, many people adopt a heuristic: “Anyone claiming that they can beat the markets is a grifter”. Negative comments are much more visible than quiet success stories, and so in this blog I want to achieve something different.

I’m just going to explain how to model these markets. I’m going to give you the methodology, and the data.

If you want to copy this for your own betting, offline and without any subscription – then please read on.


Building an Independent Player Model

Every player pricing model starts with exactly the same question.

How many goals is this match expected to produce?

Everything flows from that.

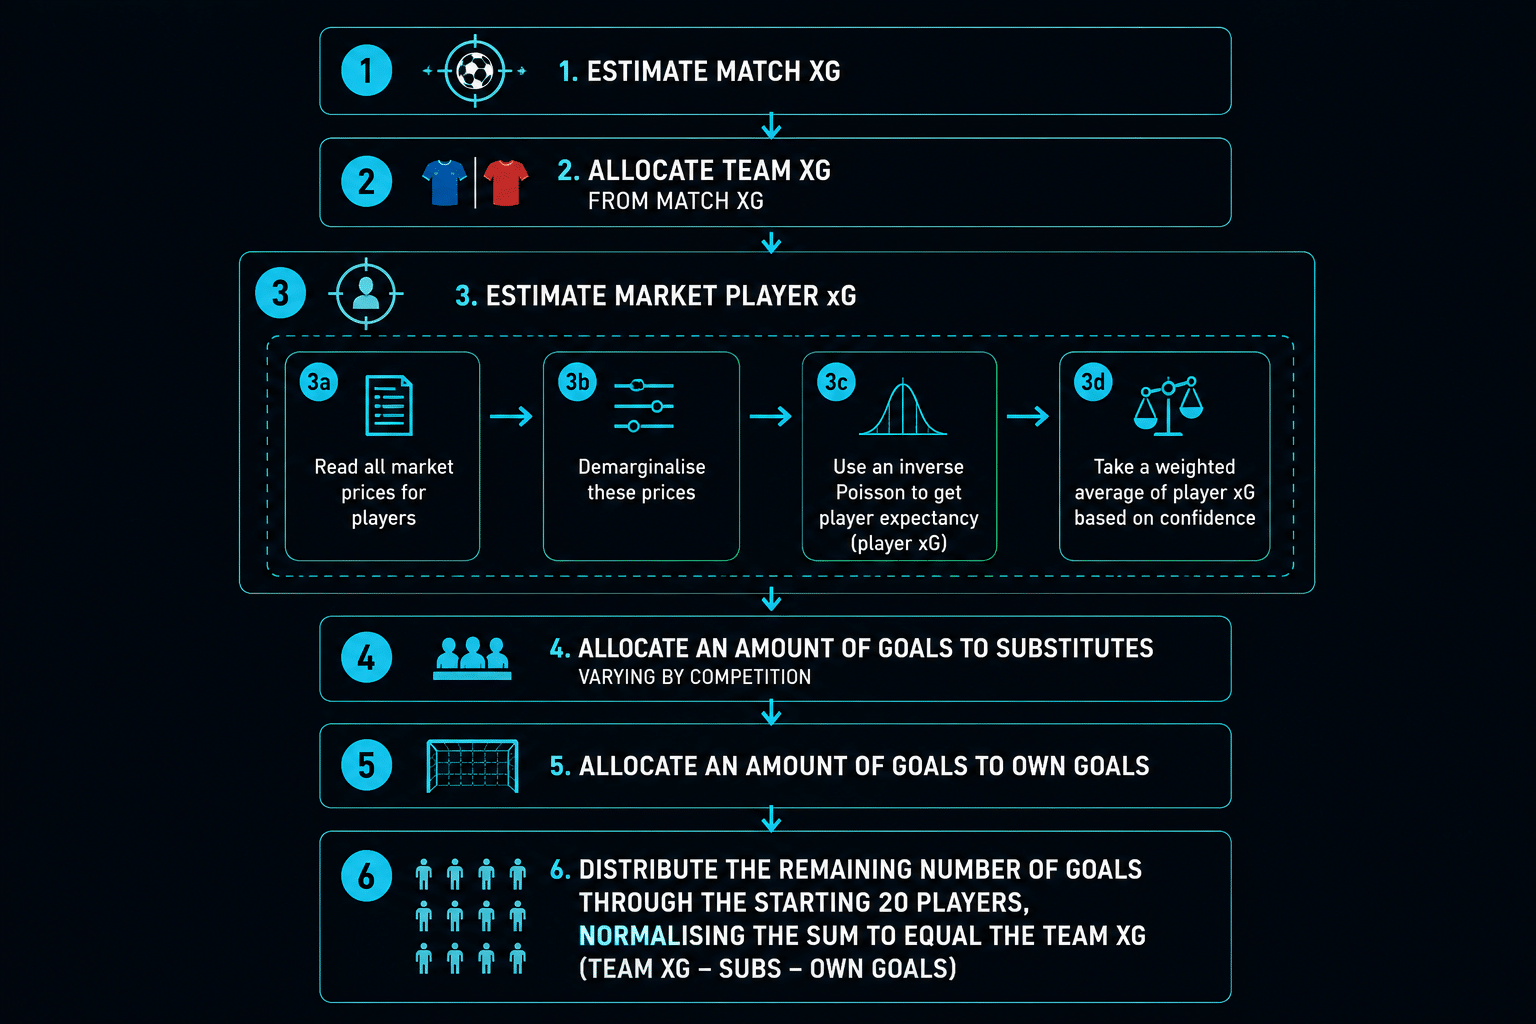
Our first task is to estimate the expected goals (xG) for the match before splitting that total into expected goals for each team. In a rigged Italian Serie C game that is destined to finish 0-0, no player is going to be a Haaland-price to score a goal. And in a super-high-scoring Swiss 2nd division game, the strikers can be heavily odds on to get a goal. All prices are relative to the Match xG.

This Match xG then gets distributed amongst the starting players.

But before allocating goals to individual players, we first reserve a proportion for substitutes and another proportion for own goals. Those goals have to come from somewhere, and failing to account for them will systematically overestimate the starting XI.

Only once those adjustments have been made do we distribute the remaining expected goals amongst the starting players.

This is where the real modelling begins.

Imagine a team unexpectedly names a starting line-up with very few attacking players. The team’s expected goals haven’t suddenly disappeared. Instead, those goals become concentrated amongst the remaining attacking options, increasing their individual probability of scoring.

Likewise, if a team starts with five genuine attacking threats, those same expected goals now have to be shared across more players, reducing each individual’s chance of scoring.

Those subtle changes are not always reflected efficiently by the market.

By generating our own probabilities rather than relying on bookmaker or exchange prices, we can identify situations where individual players appear to be over or under-priced.
Why the Exchange Isn’t Always the Right Price for Goalscorers

One of the biggest misconceptions in betting is that exchange prices are always efficient.

They’re certainly more efficient than most bookmaker prices, and over time the exchange tends to be an excellent benchmark. However, exchange markets don’t exist in isolation. In reality, there is a constant flow of information between bookmakers and exchanges, with prices reacting to one another throughout the day.

If several major bookmakers move a player’s Anytime Goalscorer price, exchange traders often respond quickly. Likewise, bookmaker traders monitor exchange activity when managing their own books. The two markets are closely linked. Concessions such as Super Sub align the bookmaker and exchange prices even further.

That creates an interesting opportunity.

If a bookmaker initially publishes an inefficient player price, there is a good chance that inefficiency will influence the exchange rather than being corrected immediately. Instead of asking whether the exchange price is “correct”, we ask a different question:

“What should the price be based on our own model?”

Only after generating our own fair odds do we compare them with the exchange.

If our model believes a player should be 5.20 and the exchange is offering 6.00, we have a potential back opportunity.

Equally, if our model believes a player should be 10.00 and the exchange is trading at 8.00, there may be value in laying that player.

The important point is that the exchange price is never an input into our model. It is only used afterwards as a benchmark to determine whether value exists.

This distinction is fundamental.

Many bettors begin with the market and try to decide whether they agree with it. We begin with our own probabilities and only then compare them with the market. That independent approach is what allows genuine pricing discrepancies to be identified.

Why Laying Opportunities Are Often Overlooked

Many bettors are perfectly comfortable backing a player at 6.00 or 8.00, but the idea of laying a player at 50.00 or even 100.00 feels intimidating.

On the surface, that concern is understandable. Large prices imply large liabilities.

However, the First Goalscorer market has an important characteristic that many people overlook.

Only one player can score the first goal of the match.

That means every lay position shares the same underlying liability. If you lay multiple players in the First Goalscorer market, only one of those players can ever beat you. You are not exposing yourself to the full liability on every individual player in the same way you would in an Anytime Goalscorer market.

This is very different from Anytime Goalscorer betting.

If you lay four players to score at any time, all four players could score in the same match, meaning each liability remains independent. That is why liability management is significantly more important for Anytime Goalscorer strategies.

Throughout this article we’ll show results using different liability caps for First Goalscorer lays. While removing the cap generated the highest overall profit during the World Cup, many bettors would naturally prefer limiting their maximum liability in exchange for a smoother equity curve and lower drawdowns.

As with every aspect of value betting, the correct approach depends on your own bankroll, risk tolerance and long-term objectives.


The World Cup Results

One of the biggest problems with betting content online is selective reporting.

It’s easy to show a handful of winning bets, a profitable month or a graph that happens to trend upwards. It’s much harder—and much more meaningful—to publish the complete dataset, including the parts that didn’t perform as expected.

That’s exactly what we’ve done here.

Every qualifying Anytime Goalscorer and First Goalscorer price generated by our model throughout the World Cup has been included in this analysis. Nothing has been filtered out because it performed poorly, and nothing has been added because it makes the results look more impressive.

The downloadable spreadsheet accompanying this article contains the aggregated data used to produce every chart below. BookieBashing members can also inspect historical prices through our archive tool, allowing them to compare our closing fair odds with the exchange closing prices for individual matches throughout the tournament.

This transparency is important.

A profitable strategy should be able to stand up to scrutiny.

Overall Strategy Performance

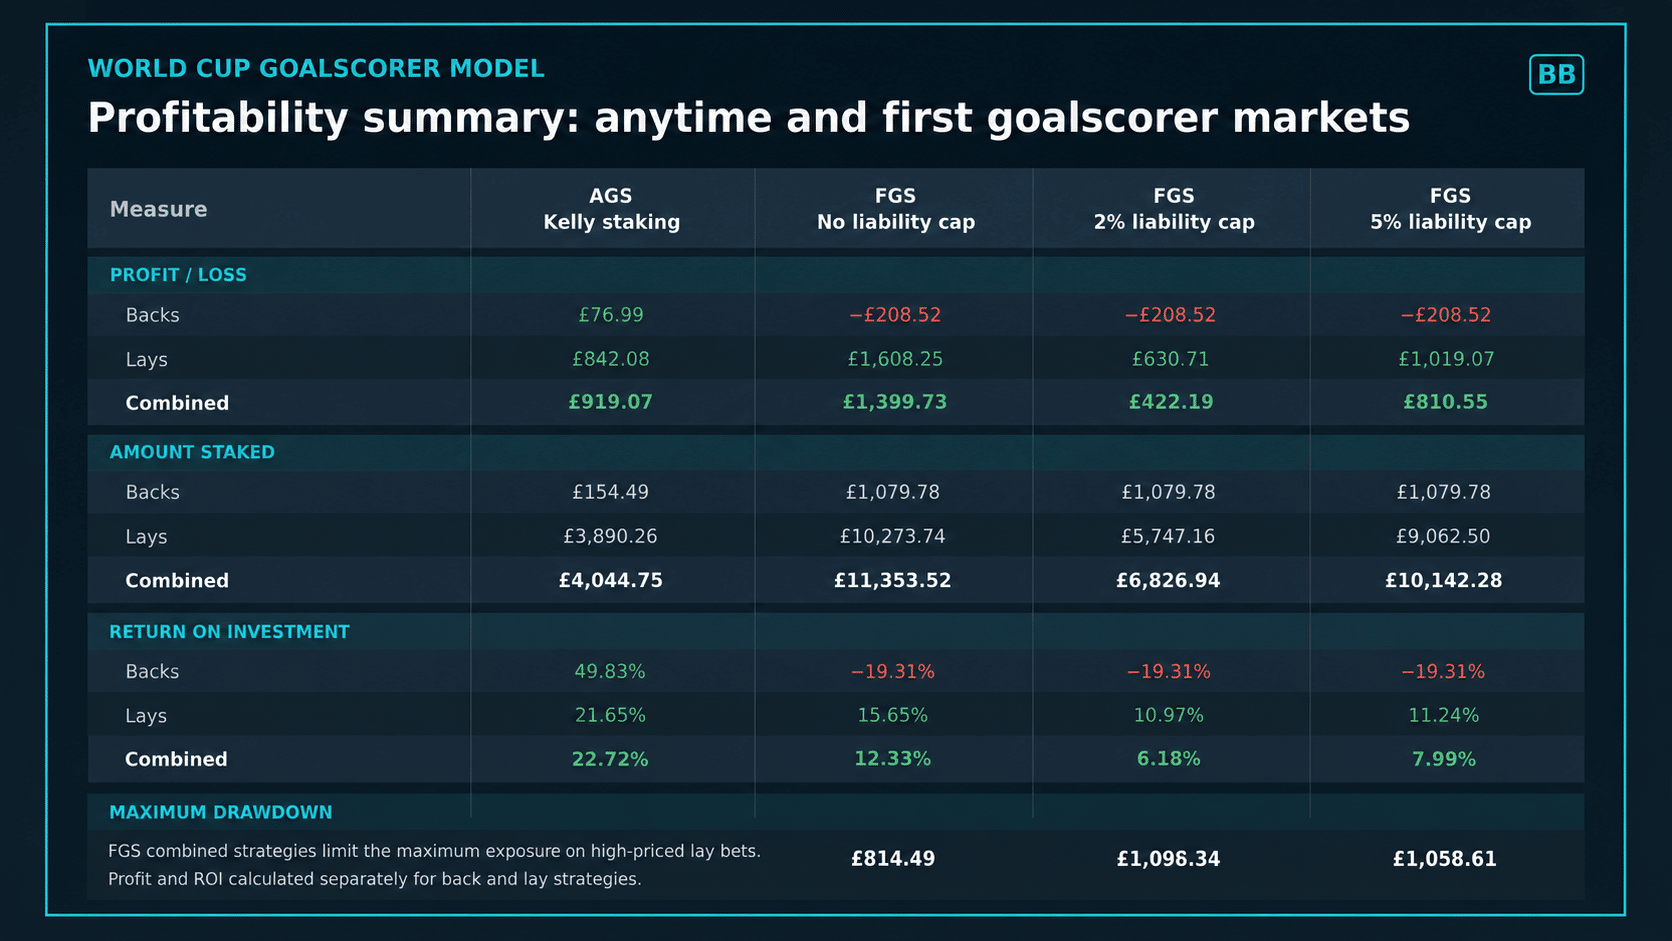
When the complete Anytime Goalscorer strategy was combined using Kelly staking, including both back and lay opportunities, the model finished the tournament with a profit of £919.07 from £4,044.75 staked, representing an overall return on investment of 22.72%.

The First Goalscorer strategy produced an even larger overall profit. Combining both backs and lays without a liability cap resulted in a total profit of £1,399.73 from £11,353.52 staked, with an overall ROI of 12.33%.

It is worth stressing that these figures relate to a tournament consisting of just 104 matches.

Although that generated well over a thousand qualifying player prices, it is still far too small a sample to draw definitive conclusions about the long-term profitability of either strategy. Football betting—particularly player betting—is inherently high variance, and no statistician should claim otherwise.

Instead, these results should be viewed as a case study demonstrating that an independently generated pricing model was capable of consistently identifying value against exchange closing prices over the course of an entire major tournament.
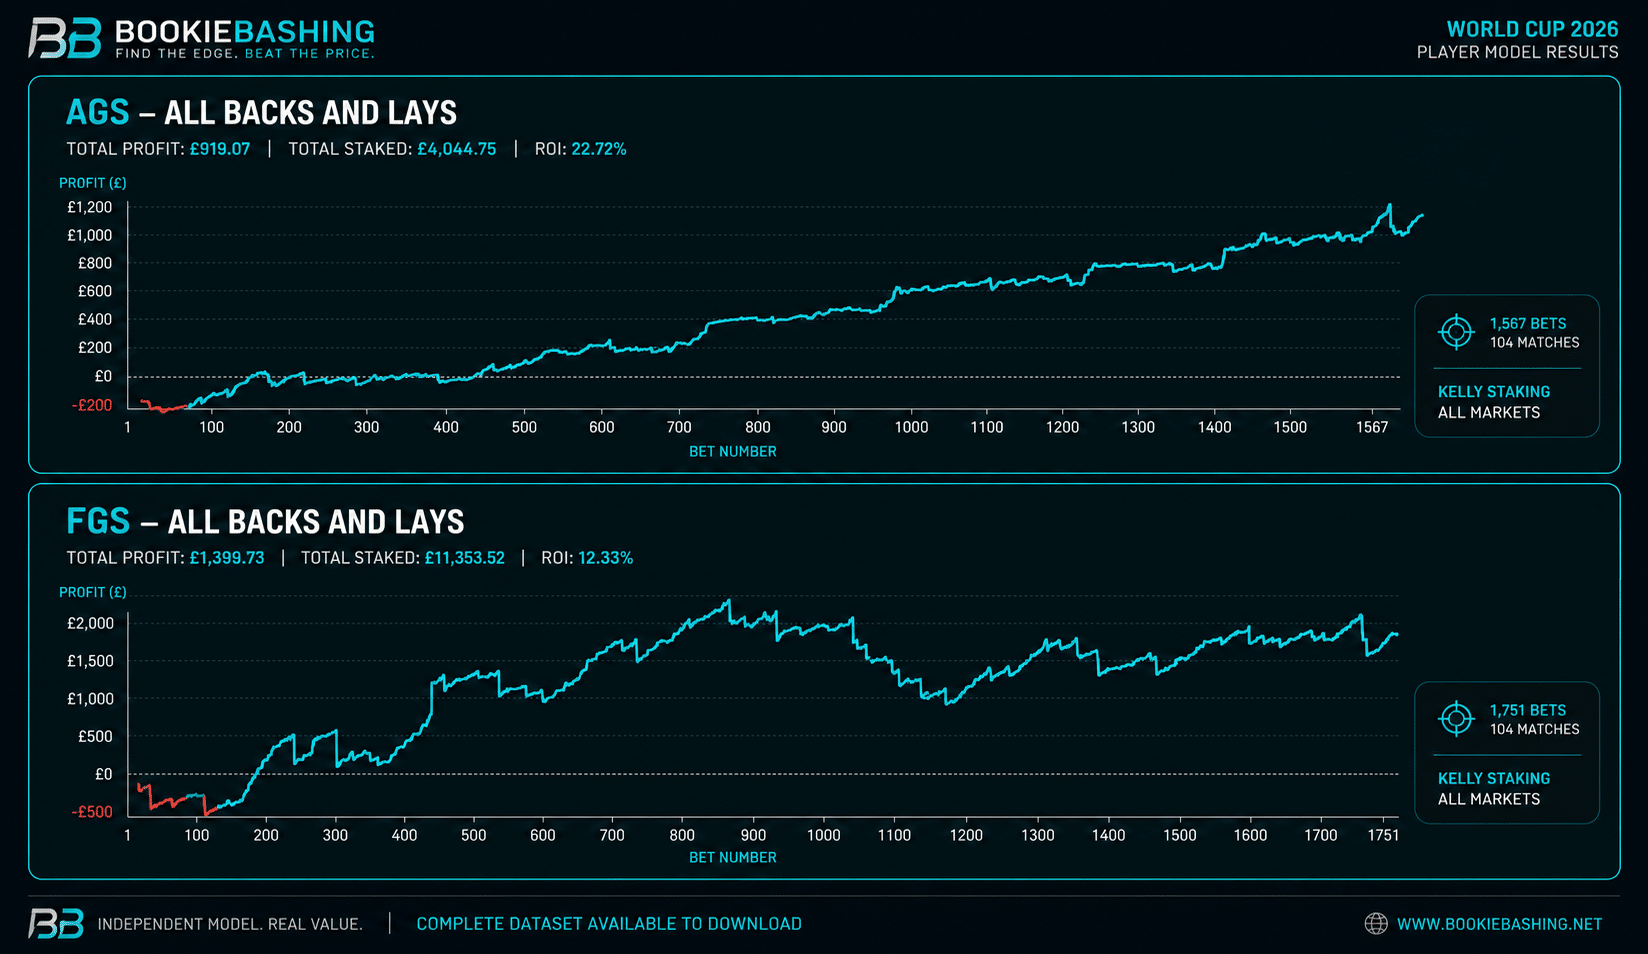

The Anytime Goalscorer strategy produced what most value bettors like to see—a relatively steady equity curve. There were numerous drawdowns throughout the tournament, but the general direction remained positive, reflecting a consistent accumulation of small edges rather than dependence on one or two unusually large wins.

The First Goalscorer market told a slightly different story.

Although ultimately more profitable, the journey was considerably more volatile. This is exactly what we’d expect. Higher prices naturally produce larger swings, while laying players at long odds increases both potential returns and short-term variance.

At one stage the strategy was approaching £1,900 profit before suffering a substantial drawdown, eventually recovering to finish over £1,399 ahead.

This is an important reminder that profitable betting strategies rarely move in a straight line. Even when the underlying model is performing well, variance will always play a significant role over shorter periods.

Different Staking Approaches

The summary table also highlights another important point.

Changing the staking methodology doesn’t change whether a bet represents value—but it can dramatically alter the experience of following that strategy.

For First Goalscorer lays, we analysed three different approaches:

  • No liability cap.
  • A 5% liability cap.
  • A 2% liability cap.

Removing the cap produced the highest overall profit, but it also required the greatest exposure and resulted in the largest drawdowns.

Introducing liability caps reduced both risk and reward. Some bettors will quite reasonably prefer sacrificing a portion of the expected return in exchange for a smoother equity curve and lower bankroll volatility.

There is no universally correct answer.

The optimal staking strategy depends on your bankroll, your tolerance for variance and, perhaps most importantly, your ability to remain disciplined during inevitable losing periods.

The important takeaway is that the underlying model continued to identify value regardless of how the stakes were managed. Staking determines how efficiently that value is converted into long-term bankroll growth; it does not create the edge in the first place.

Why We Show Losing Strategies

It would be easy to stop with the two profitable overall graphs above.

However, doing so would hide one of the most important lessons in this analysis: individual components of a profitable strategy can still lose over a short sample.

Backing positive-EV First Goalscorer selections finished the World Cup at a loss under both Kelly staking and Unit Win staking.

That does not automatically mean the underlying approach was wrong. Nor does the fact that the strategy was profitable halfway through the tournament prove it was right.

Earlier in the World Cup, we published a graph showing healthy profits from backing First Goalscorer selections. Had the tournament ended at that point, it would have been tempting to present the strategy as a clear success.

The remaining matches changed the picture completely.

Profits fell away sharply and the strategy ultimately finished in negative territory.

This is precisely why we believe complete datasets are so important. A graph taken from the most flattering point in time can create an entirely false impression of how a strategy has performed.
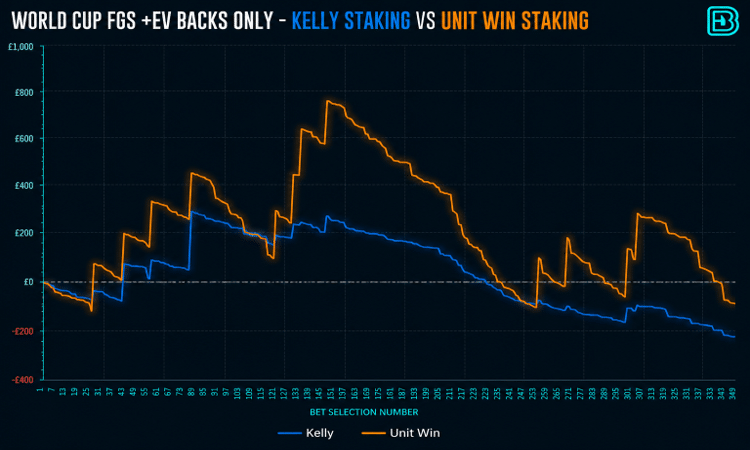


The chart also demonstrates why short-term profitability is not the same thing as long-term validation.

The World Cup contained only 104 matches. First Goalscorer is also a high-variance market, with many bets placed at relatively large prices. Even when a model has accurately identified value, the realised results over such a small number of matches can be dominated by variance.

A positive expected-value bet can lose.

A group of positive expected-value bets can lose.

An entire tournament of positive expected-value bets can lose.

The purpose of a value model is not to predict that every short sequence will make money. It is to identify prices that should produce a positive return when the process is repeated across a sufficiently large number of opportunities.

That is why we do not judge the model solely by this losing component, just as we would not judge it solely by a profitable graph produced halfway through the tournament.

When the First Goalscorer backs and lays were combined, the complete strategy finished profitably. The losing back-only result remains part of the evidence and should not be hidden.

In our view, showing unprofitable results creates more confidence than only publishing the graphs that go upwards.

Where Did the Model Find Value?

The next question is not simply whether the model made a profit, but what the available opportunities looked like.

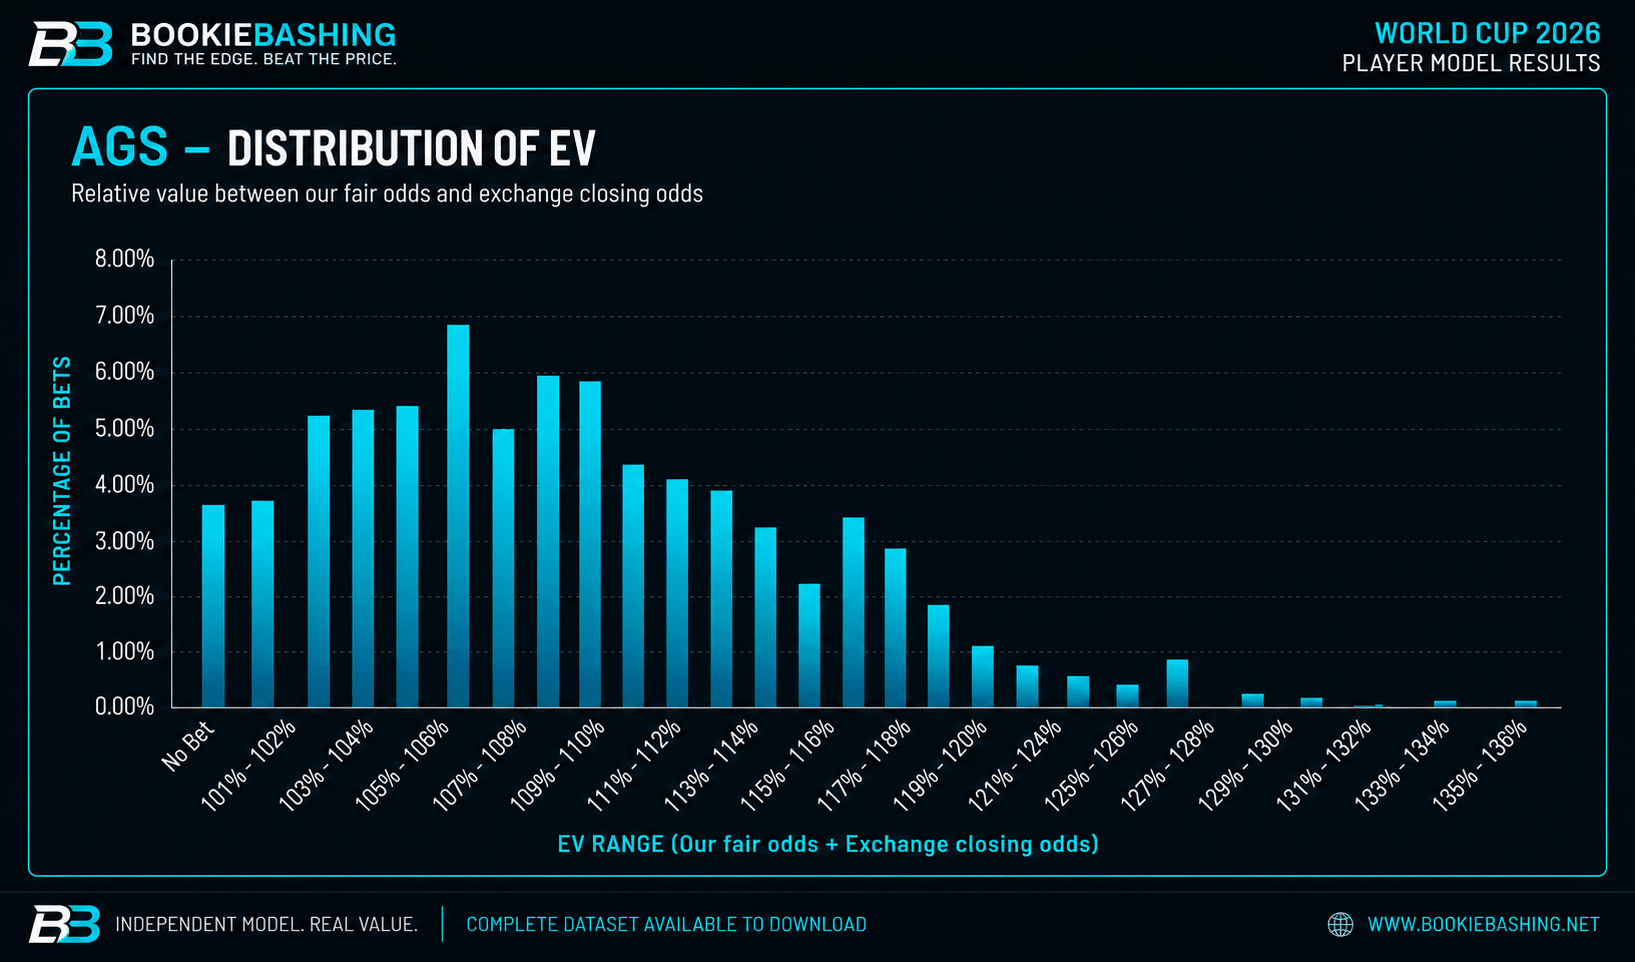
The two charts below show the distribution of the relative pricing edges identified in the Anytime Goalscorer and First Goalscorer markets.

Most qualifying opportunities were not enormous pricing errors. They were relatively modest differences between our fair odds and the exchange price.

That is exactly what we would expect in a reasonably efficient market.
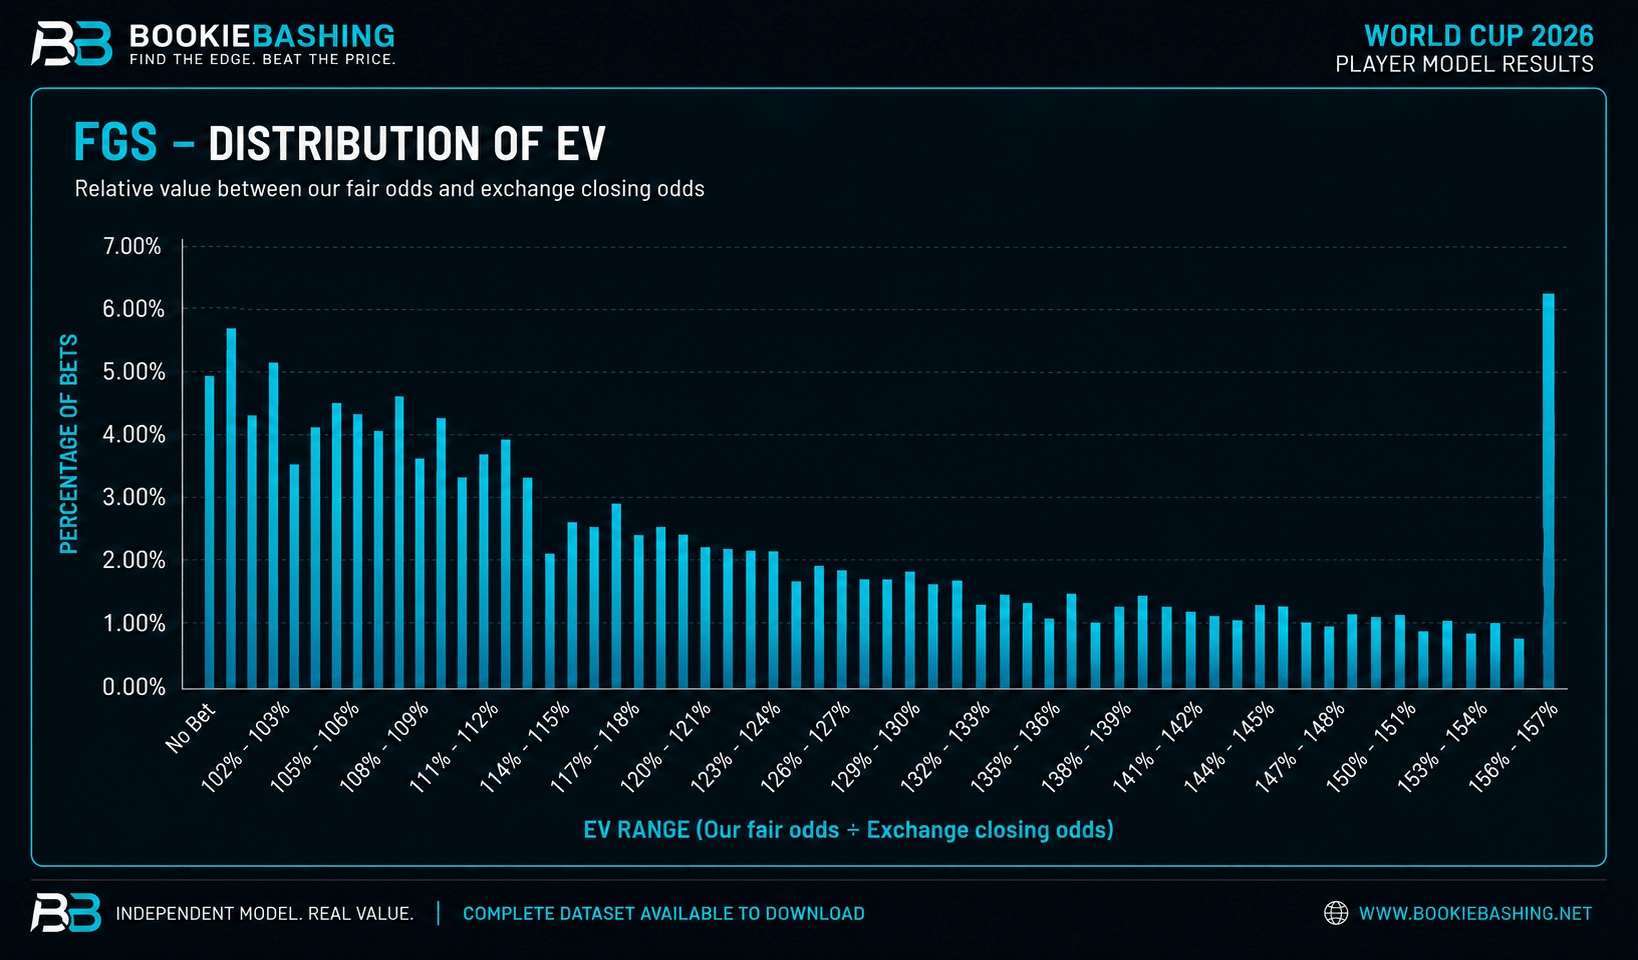


The charts show that the model was not dependent on regularly finding players priced at dramatically incorrect odds.

Most opportunities sat within a comparatively narrow range above our minimum value threshold. Very large discrepancies were much less common.

This supports the central idea behind a structured value-betting system.

The objective is not to wait for one extraordinary mistake. It is to repeatedly identify smaller pricing errors, apply a consistent staking method and allow those edges to accumulate over hundreds or thousands of bets.

A technical note on backs and lays

There is an important caveat when interpreting these distributions.

Back and lay value are not naturally expressed on an identical scale.

For example, backing at odds of 6.00 when our fair odds are 5.20 produces a straightforward odds ratio of approximately 115%. The equivalent lay calculation is not economically symmetrical because lay returns are measured against the liability rather than simply the stake.

Using the strict expected-return calculation for lays would compress a very large proportion of qualifying lay bets into a narrow range around 100–102%. That would make the combined distribution difficult to interpret visually.

For these charts, we therefore used a common relative-price comparison by dividing one price by the other in the appropriate direction. This allows the back and lay opportunities to be shown together on a comparable scale.

The figures should therefore be read as a measure of the relative pricing advantage identified by the model, rather than as the exact expected return on capital for every lay bet.

That distinction matters, but it does not change the broader conclusion: the strategy was driven primarily by a large number of modest pricing discrepancies rather than a small number of extreme outliers.


What Can We Conclude?

At this point it’s important not to overstate what these results prove.

The 2026 World Cup consisted of just 104 matches. Although that generated well over a thousand qualifying player prices, it is still a relatively small sample when analysing high-variance football betting markets.

One profitable tournament does not prove a model is perfect.

Equally, one losing tournament would not prove that it doesn’t work.

That isn’t how statistical modelling should be evaluated.

Instead, what this World Cup provides is a complete, transparent case study of an independently generated pricing model being tested against one of the most efficient betting markets available.

The results are encouraging, but perhaps more importantly, they make sense.

The model wasn’t dependent on finding huge pricing errors.

It wasn’t dependent on one extraordinary winner.

It didn’t avoid publishing losing components.

Instead, it repeatedly identified relatively small pricing discrepancies and applied the same disciplined process throughout the tournament.

That consistency is exactly what we’d hope to see from a robust value betting methodology.

Can You Build Your Own Model?

One of the reasons I’ve written this article is because I genuinely believe bettors should think more independently about pricing football markets.

There is nothing stopping somebody from building their own player model.

The process is relatively straightforward to describe:

  • Estimate the expected goals for the match.
  • Split those goals between the two teams.
  • Reserve an appropriate proportion for substitutes.
  • Reserve an appropriate proportion for own goals.
  • Distribute the remaining expected goals across the starting eleven.
  • Convert those probabilities into fair odds.
  • Compare those prices with the exchange.
  • Bet only when sufficient value exists.

That’s the methodology.

The difficult part isn’t understanding it.

The difficult part is building a model that produces reliable numbers, maintaining it throughout the season, processing team news, generating prices for thousands of players and continuously testing whether the probabilities remain well calibrated.

That is where the overwhelming majority of the work sits.

How BookieBashing Uses This Methodology

Everything you’ve seen in this article is powered by the same underlying player modelling system that sits behind the BookieBashing Player xG tools.

Rather than simply producing prices after the starting line-ups have been announced, our software allows members to experiment with different line-ups before kick-off and immediately see how those changes affect player probabilities.

For example, you can remove a striker from the starting eleven, introduce another attacker, or change the expected line-up entirely and instantly see how those changes flow through to:

  • Anytime Goalscorer
  • First Goalscorer
  • Two or More Goals
  • Three or More Goals

The same modelling process also powers our wider Player Stats tools, covering markets such as:

  • Shots
  • Shots on Target
  • Tackles
  • Passes
  • Fouls
  • Saves
  • Cards

Each market begins with a team expectation before distributing that expectation intelligently amongst the players expected to take part.

Historically, this type of player modelling has largely been the domain of bookmaker traders and professional betting syndicates.

Today, we’re making those same modelling principles available to recreational bettors who want to make their own informed decisions rather than simply following bookmaker prices.

Download the Data

Transparency has always been important to us.

That’s why we’ve included the complete aggregated World Cup dataset alongside this article.

You’re welcome to download the spreadsheet, inspect the figures yourself and analyse the results however you wish.

If you’re already a BookieBashing member, you’ll also find our historical archive contains the underlying fair odds and exchange closing prices for individual matches beyond the World Cup, allowing you to explore the data in even greater detail.

Whether you agree with every modelling decision or not, I hope this article demonstrates one thing above all else:

Exchange prices should be respected—but they don’t have to be accepted as the final word.

If you can build an independent model capable of generating reliable probabilities, compare those prices with the market and consistently apply disciplined staking, there is every reason to believe that value can be found on both sides of the exchange.

The World Cup provided one transparent case study.

The upcoming domestic season will provide thousands more opportunities to continue testing, refining and improving the model.

Download the World Cup dataset

(Insert download button/link here.)

Explore the BookieBashing Player xG & Player Stats tools

(Insert CTA/button here.)

Final Thoughts

When I started building football player models, I wasn’t trying to prove that the exchange was wrong.

I was trying to answer a much simpler question.

“If I ignore the market completely and generate my own probabilities, how often will I disagree with it?”

The World Cup gave us another opportunity to test that idea using a complete tournament from start to finish.

There were winning periods.

There were losing periods.

Some strategies exceeded expectations, while others underperformed.

That’s exactly what we’d expect from a relatively small sample in high-variance betting markets.

What encourages me isn’t any single graph or any single profit figure.

It’s that an entirely independent pricing model repeatedly found opportunities where our numbers differed from one of the most efficient betting markets available.

That doesn’t mean we’ll always be right.

It doesn’t mean every tournament will be profitable.

And it certainly doesn’t mean variance suddenly disappears.

What it does mean is that I remain convinced of the same principle that has underpinned BookieBashing from the very beginning:

Value comes from producing better probabilities than the market—not from predicting winners.

If this article has encouraged you to think differently about football betting, then it has achieved its aim.

Whether you decide to build your own model from scratch or use the tools we’ve developed at BookieBashing, I hope one message stays with you:

Don’t start with the market.

Start with your own numbers.

Only then should you compare them with everybody else’s.

If you’d like to explore the data yourself, download the spreadsheet accompanying this article. If you’d like to see how we’ve automated this entire process, you’ll find links to our Player xG and Player Stats tools below.

As always, if you have any questions about the methodology or the analysis, feel free to get in touch.

Good luck, and good betting.