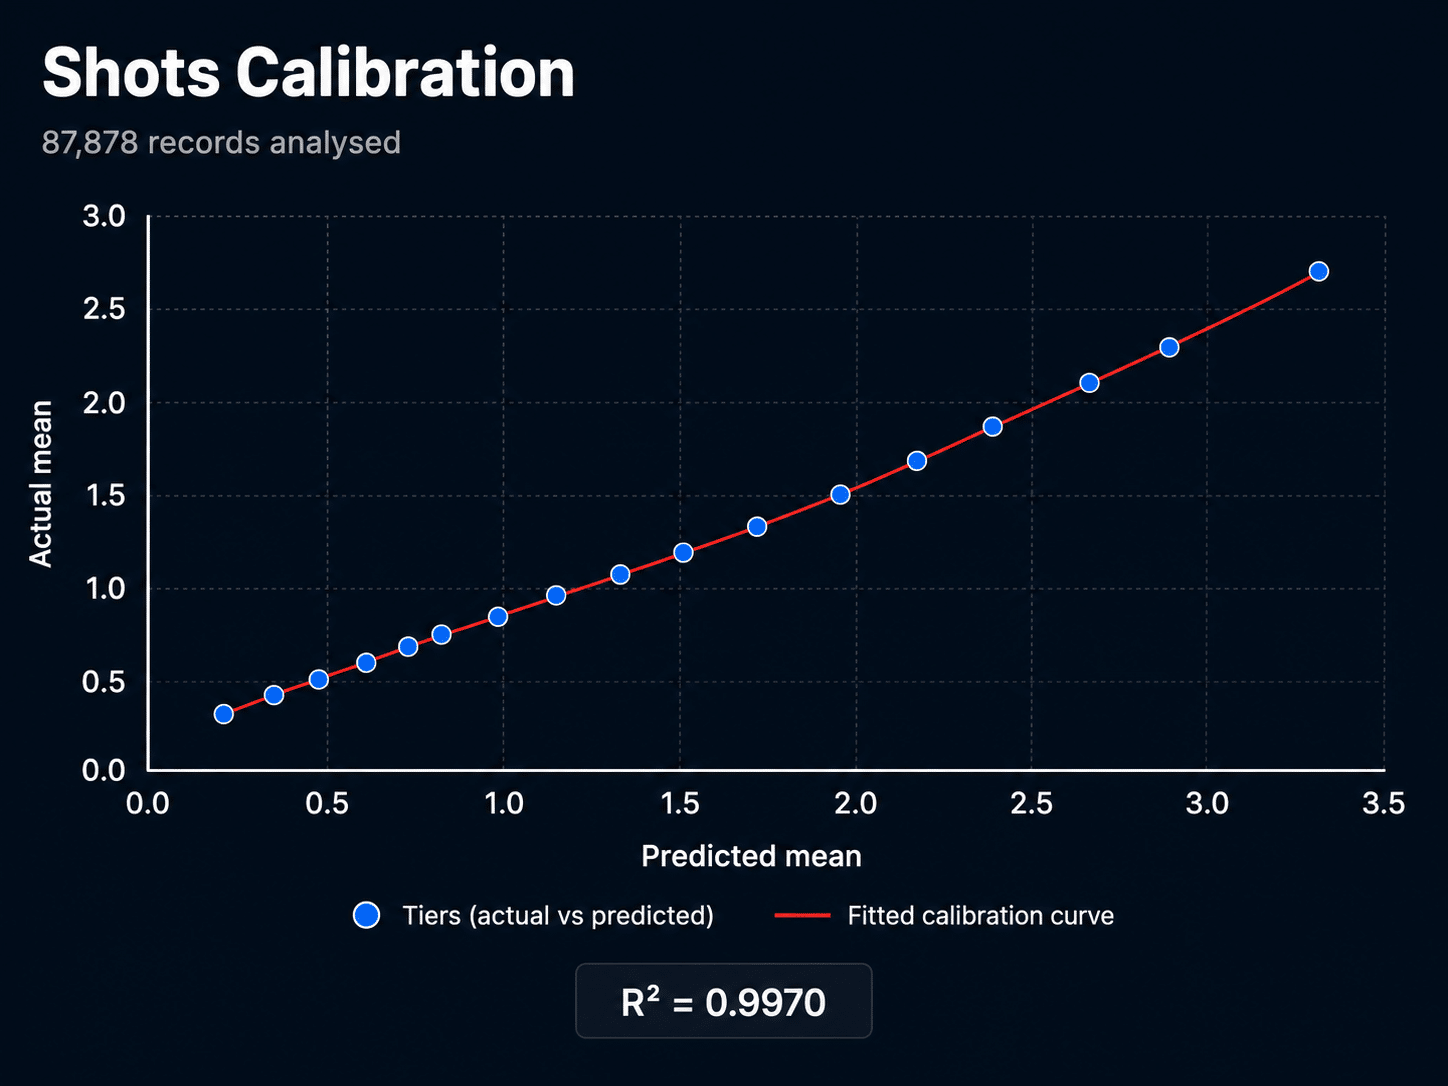
Our player-stat figures are rebuilt and recalibrated every week using hundreds of thousands of bookmaker predictions and real-world outcomes.

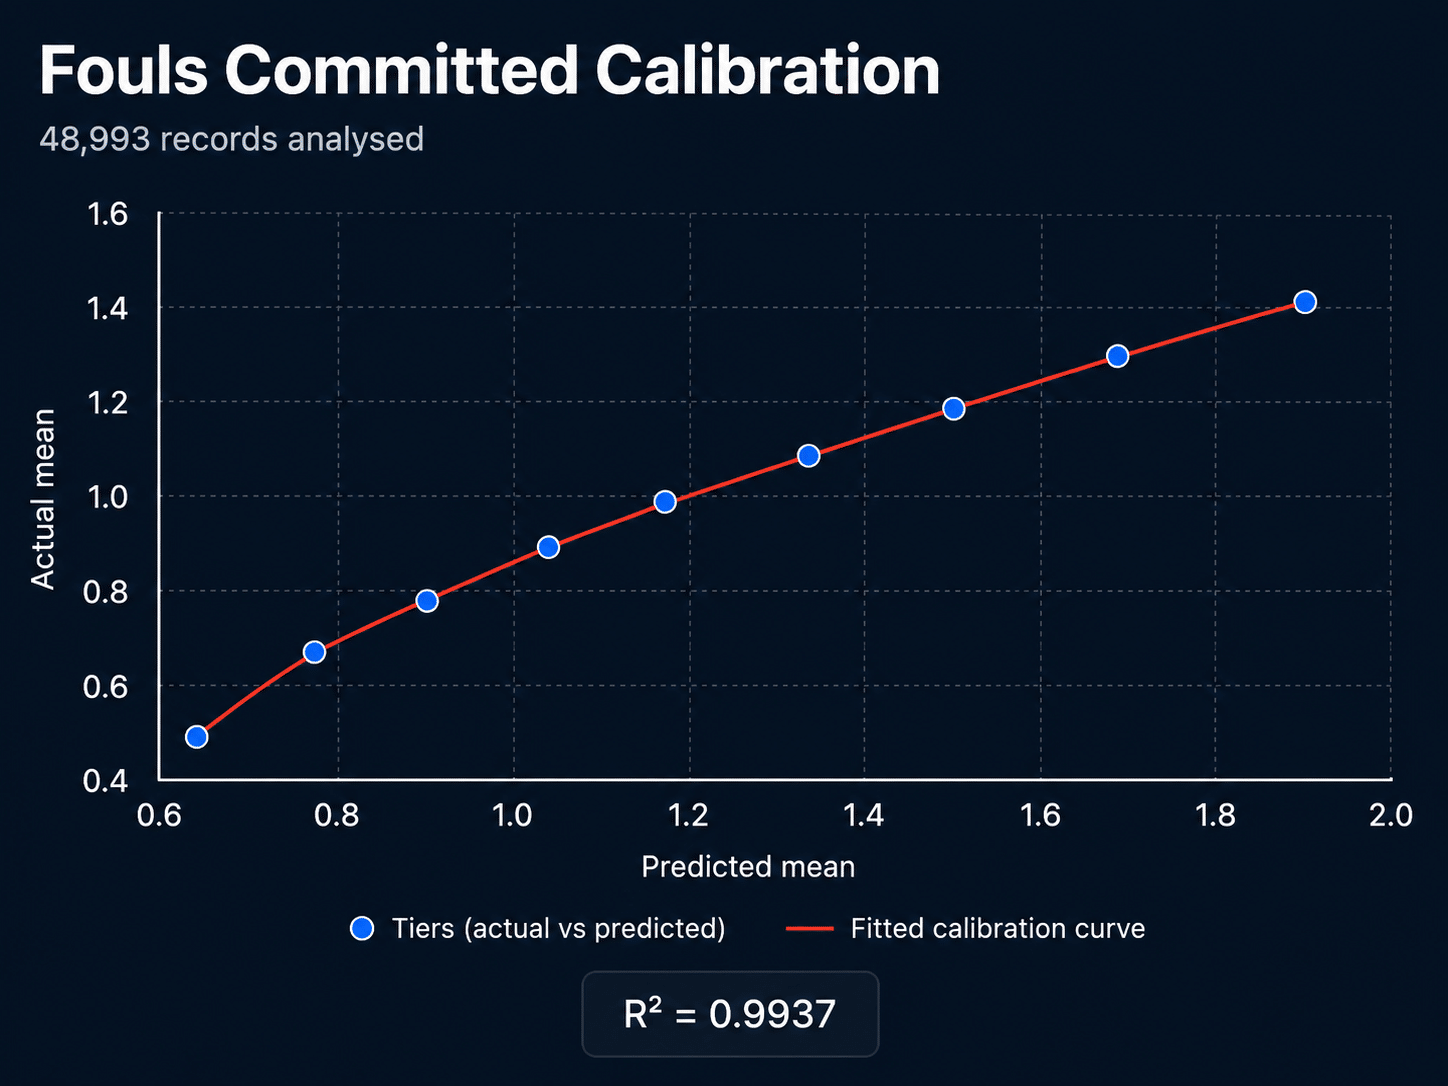
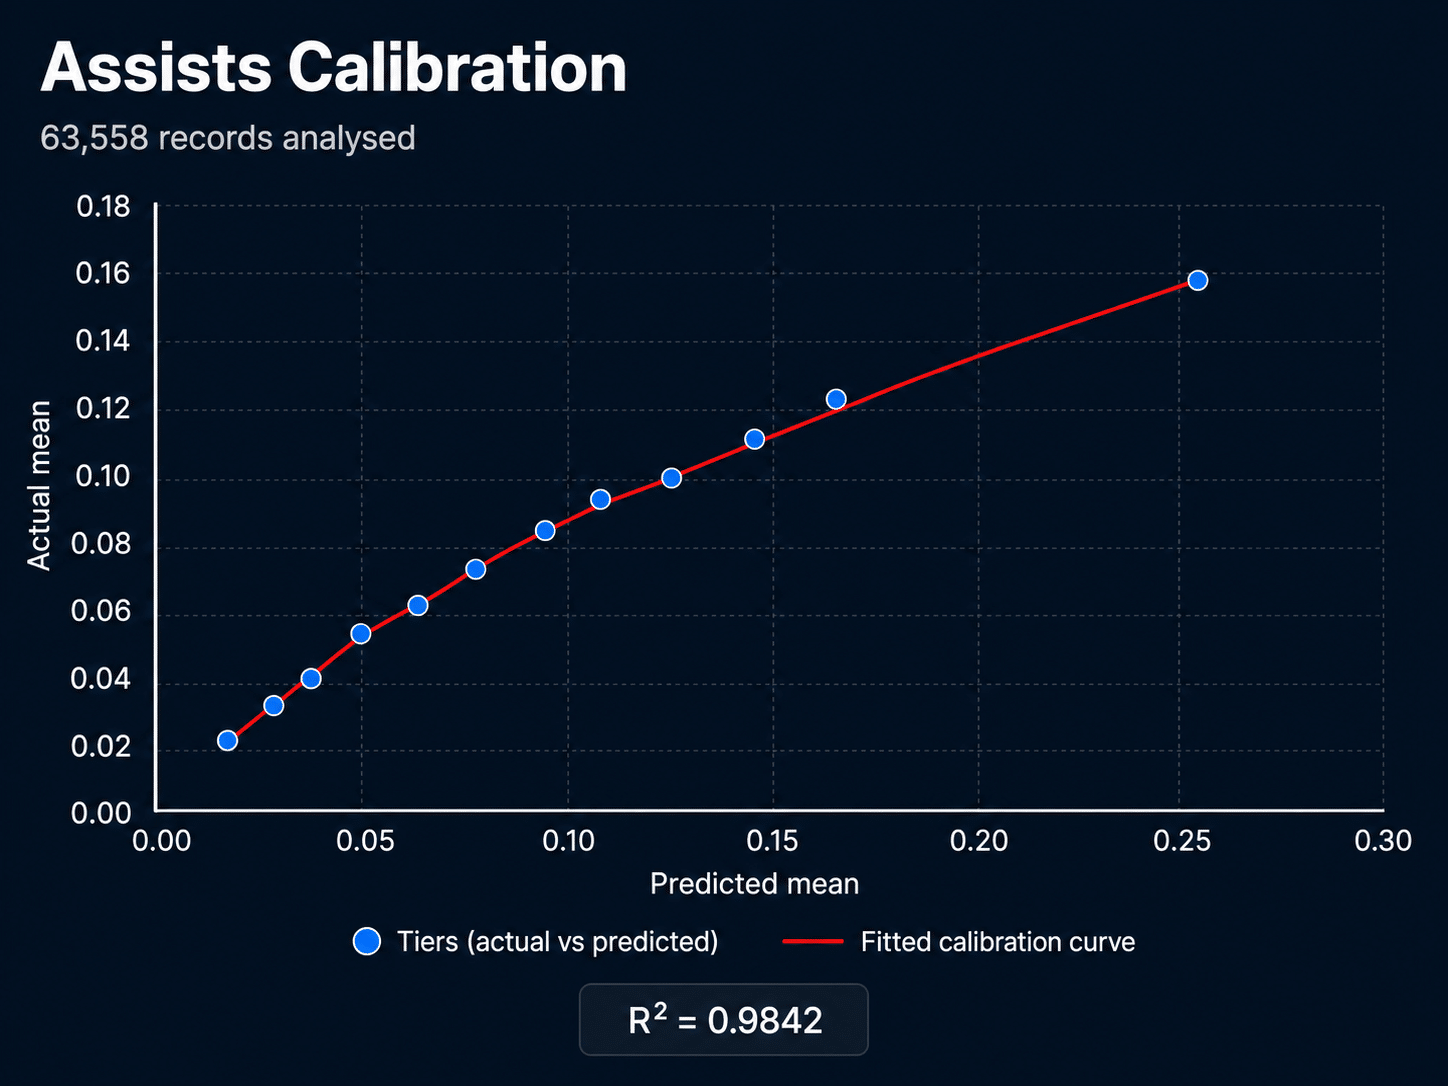
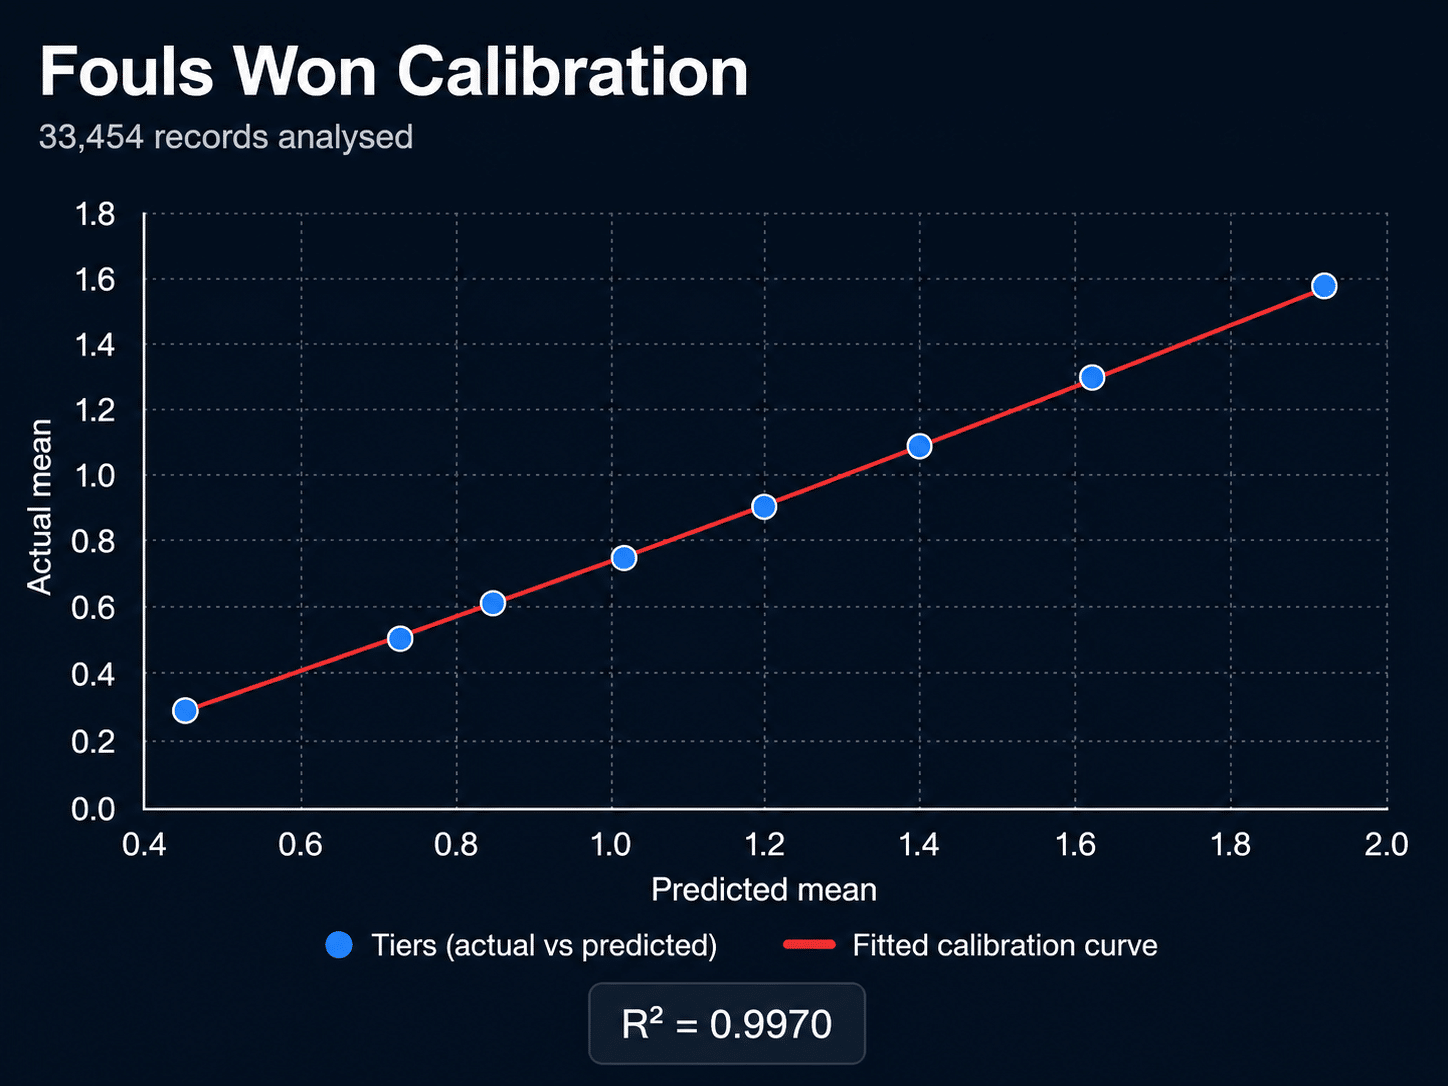
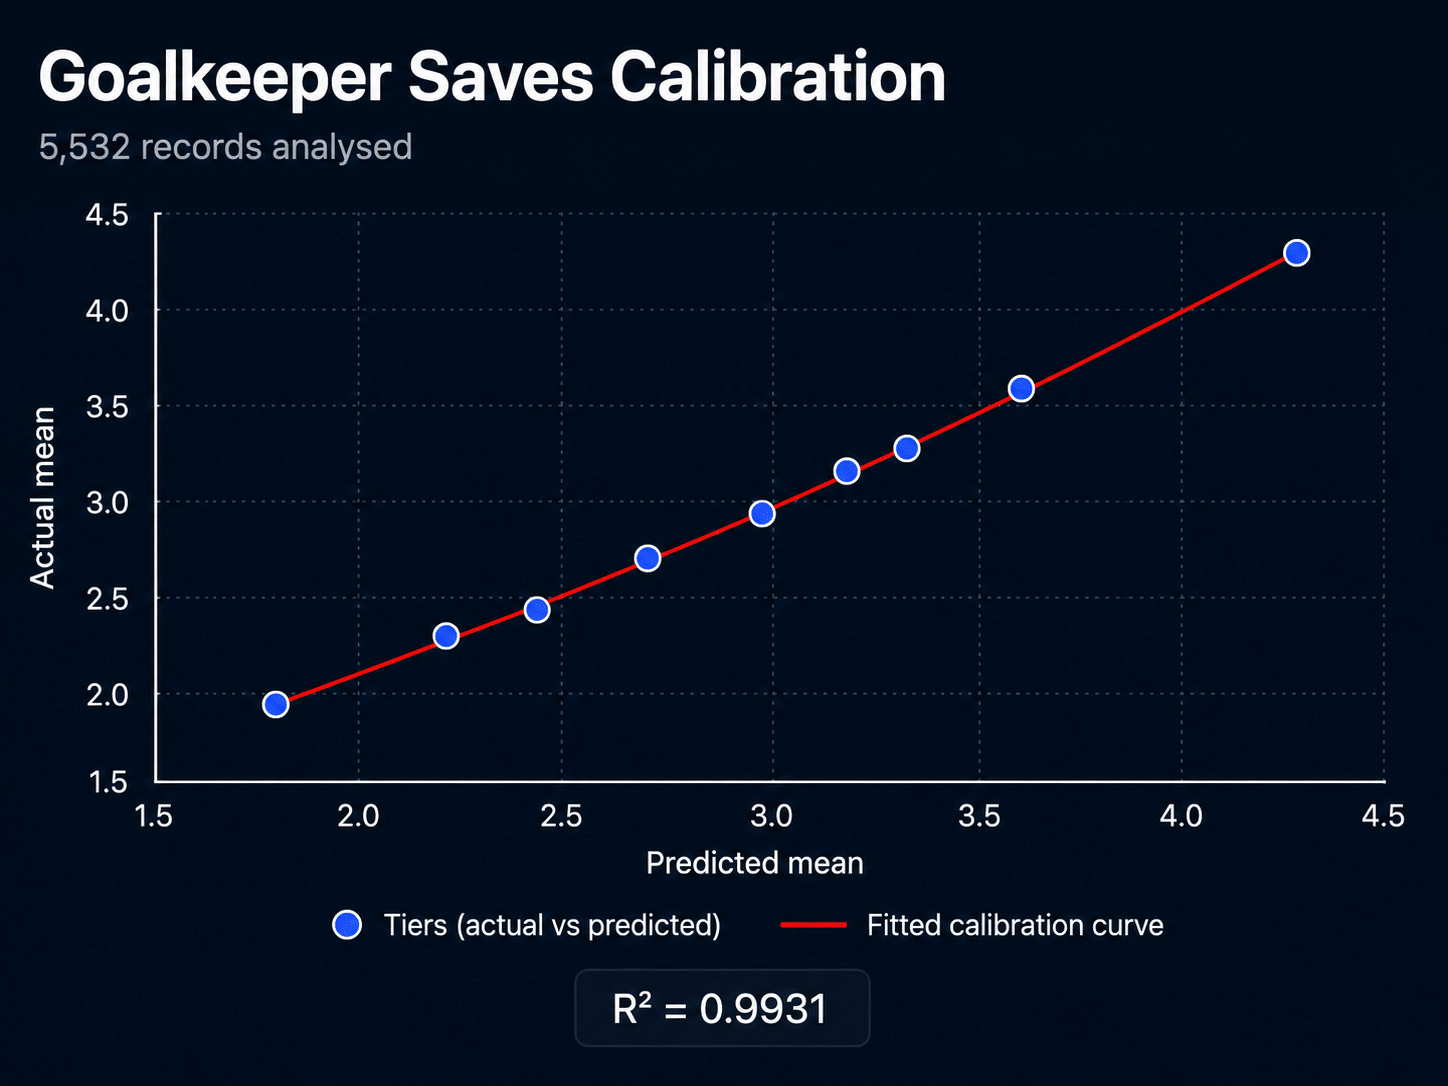
Each point represents a group of players with similar market-implied expectancies. The fitted curve shows the adjustment required to align those predictions with the results that actually occurred.
Members regularly see player-stat expectancies throughout BookieBashing, but most of the work that produces those numbers happens quietly in the background.
They are not simple averages, generic season statistics or figures copied directly from bookmaker prices. Every expectancy passes through a structured calibration process that is continually tested against what actually happens on the pitch.
Starting with the market
Bookmaker prices contain a large amount of useful information. They reflect team strength, the opposition, the player, expected minutes and numerous other factors.
However, bookmaker odds also include a profit margin.
For example, a bookmaker might offer:
- Over 0.5 shots on target at 1.83
- Under 0.5 shots on target at 1.83
Although both prices imply a probability greater than 50%, they cannot both be correct. We first remove that margin—or demarginalise the market—to recover the underlying market probability.
In this example, the fair probability of over 0.5 shots on target would be approximately 50%.
Under a basic Poisson assumption, a 50% chance of recording at least one shot on target would initially correspond to an expectancy of approximately 0.69. Our subsequent calibration process then adjusts that starting point using the observed behaviour of the market.
Converting probability into an expectancy
A probability of recording at least one shot on target is useful, but our models need an expected number of shots on target.
We therefore reverse the appropriate statistical distribution to convert the market probability into an initial expectancy.
In simple terms, we are asking:
What average number of shots on target would produce this probability of the player recording over 0.5?
The underlying calculation is more sophisticated than applying a basic Poisson formula. Different markets contain different biases, and the relationship between a bookmaker probability and the eventual average is not identical for shots, tackles, assists, cards or goalkeeper saves.
The market-derived expectancy is therefore only our starting point.
Testing predictions against reality
We store the market-implied expectancy and compare it with the player’s eventual result.
The records are then divided into tiers containing players with similar predicted expectancies. Within every tier, we compare:
- The average expectancy predicted by the market
- The average result that actually occurred
This allows us to see whether the original market estimate was well calibrated.
For example, did players with an average prediction of 1.50 tackles actually record approximately 1.50 tackles? Or did they average only 1.20?
Most importantly, we do this separately for every player-stat market.
A different calibration for every statistic
The latest calibration covers more than 450,000 individual player-stat records across the examples shown below:
| Player statistic | Records analysed | Calibration fit (R-squared) |
|---|---|---|
| Shots on target | 94,541 | 0.9907 |
| Shots | 87,878 | 0.9970 |
| Player cards | 75,058 | 0.9955 |
| Assists | 63,558 | 0.9842 |
| Fouls committed | 48,993 | 0.9937 |
| Tackles | 44,364 | 0.9975 |
| Fouls won | 33,454 | 0.9970 |
| Goalkeeper saves | 5,532 | 0.9931 |
| Total | 453,378 | — |

Different player-stat markets display different biases. Player cards require a different calibration curve from shots on target, which is why BookieBashing calculates and regularly refreshes a separate equation for every statistic.
Each point on our calibration graphs represents a tier of similar predictions. We then fit a separate regression curve through those results.
The high R² values show that the fitted calibration curves closely describe the relationship between the predicted and realised averages across these tiers. This does not mean that individual player performances are 99% predictable. Player statistics will always contain variance. It means that, across large groups of comparable predictions, the calibration curve provides a very strong fit to the results.
The graphs also demonstrate why one universal adjustment would not be appropriate.
Goalkeeper saves are relatively close to a one-for-one relationship between the market expectancy and the eventual result. Tackles, cards, fouls and assists require different corrections. Low-probability shots-on-target and assist markets can also behave differently from the higher-expectancy tiers.
Every statistic therefore has its own equation.
Recalibrated every week
These calculations are automated and rerun every week using the latest available results.
As new information enters the database, the regression curves and calibration equations are refreshed. This means our models can adapt when the behaviour of a particular market changes instead of relying indefinitely on an adjustment created several seasons ago.
The process is designed to answer three important questions continually:
- Is the bookmaker market currently well calibrated?
- Does its bias change at different expectancy levels?
- Does our existing adjustment still provide the best fit?
Where the answer changes, our calibration changes with it.
Calibration is only the first stage
The calibrated market expectancy is not automatically the final number presented to members.
We then apply further BookieBashing modelling, including team-news adjustments and normalisation against the relevant team lines. This allows the individual player estimate to remain consistent with the wider expectation for the match.
The final expectancy is therefore built from several layers:
Demarginalised market probability → statistical expectancy → market-specific regression calibration → current team information → team-line normalisation
By the time a number appears within BookieBashing, it has already been compared with a substantial database of previous predictions and outcomes.
Why we do this
No model can remove the natural variance from an individual football match.
What we can do is ensure that our underlying expectancies are produced systematically, tested against a large amount of current evidence and updated whenever that evidence changes.
That work takes place behind the scenes, but it is a central part of how BookieBashing evaluates player-stat markets and identifies occasions where the available odds may differ from our assessment of the true probability.
The number members see may be simple.
The process behind it is not.
See how BookieBashing applies these calibrated expectancies within Player xStats.