
What 419 Exchange Bets Tell Us About Player Stats Value
One of the easiest mistakes to make in value betting is judging a model by what happened to an individual selection.
A player was priced as a lay and scored twice. A player was available at much bigger odds than our fair price, we backed him, and he didn’t manage a shot on target.
Therefore, the model must have been wrong.
That’s not how probabilistic betting models work.
Over the latest round of international matches, we tracked 419 +EV Player Stats / Player xG selections at Betfair Exchange closing prices.
The portfolio eventually finished +£290.18, but what happened underneath that headline figure is considerably more interesting.
There were losing matches, substantial drawdowns, some enormous apparent edges that lost, and one particular market that had a dreadful weekend.
The results provide a useful real-world demonstration of why we price the whole market, why we often find value on the lay side, and why individual winners and losers tell us very little about whether a price was correct.
England 7-0 Croatia: When a Good Bet Loses
England’s 7-0 victory over Croatia was a painful result for some BookieBashing users.
Our model predominantly found value on the lay side. In a match where England proceeded to score seven goals, that was never likely to be particularly friendly.
Bukayo Saka provided the most extreme example.
Our model gave Saka an xG of just 0.16, which produced fair odds of 86.36 for him to score 2+ goals.
The Betfair Exchange closing price was 32.0.
According to our model, 32.0 was considerably too short, making Saka a lay.
He scored twice.
With our staking methodology and liability cap, that single selection lost £100.
Was the model therefore wrong?
No. The bet lost.
Those are not the same thing.
If the true probability of something happening is represented by odds of 86.36, it will still happen occasionally. A fair price is an estimate of probability, not a prediction of a binary outcome.
Saka wasn’t the only England player who hurt us. Anthony Gordon and Saka both beat our anytime goalscorer lays. Harry Kane also caused losses across the goals and shots markets, while Jude Bellingham’s shot on target contributed another sizeable loss.
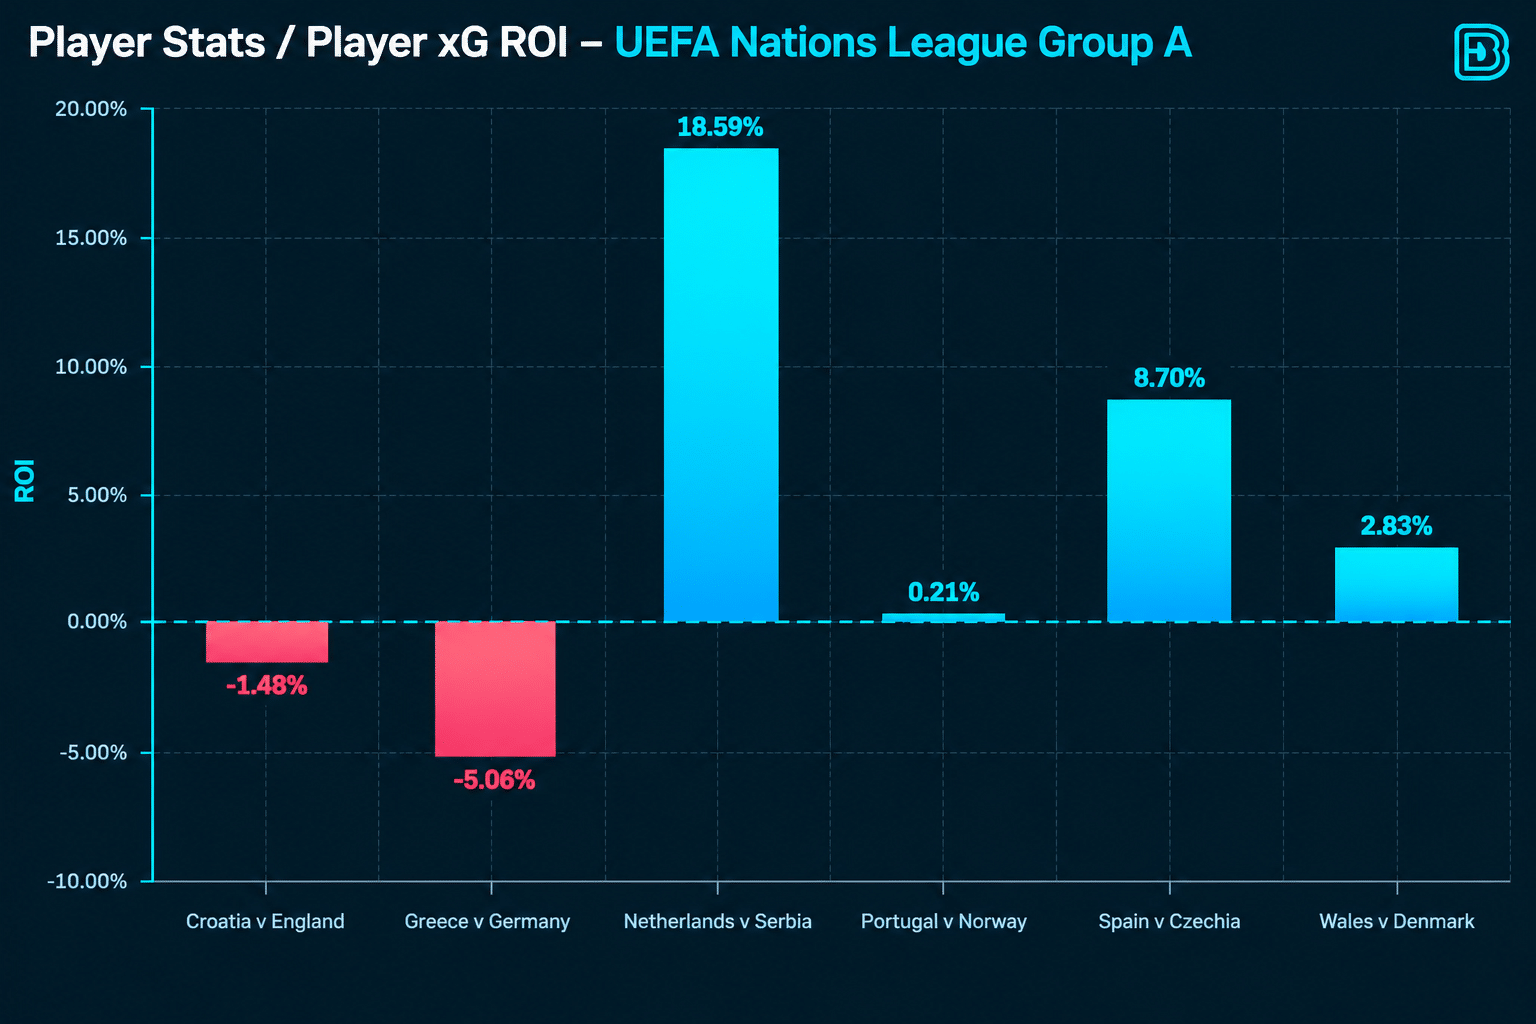
Despite all of that, and despite England winning 7-0, the complete Croatia v England portfolio finished at -1.48% ROI.
It wasn’t a good match for the model, but considering the extraordinary result, it wasn’t catastrophic either.
Where Did We Actually Find the Value?
The complete dataset contained 419 bets, but one of the most interesting findings appears when we simply separate them into backs and lays.
There were 153 back bets, which collectively lost £165.20, producing an ROI of -11.79%.
There were 266 lay bets, which made £455.38, producing an ROI of +3.69%.
Put the two together and the complete portfolio made £290.18 at +2.11% ROI.
Every penny of the overall profit, and more, therefore came from the lay side.
This is important because it illustrates one of the fundamental differences between the BookieBashing Player Stats approach and conventional betting content.
We aren’t looking for a handful of players to recommend backing.
We price everybody.
If the market offers a player at odds greater than our fair odds, there may be value in backing them. If the market offers odds considerably shorter than our fair price, the value can be on the other side.
Most betting discussion naturally starts with a question such as “Who should I back to score?” or “Who should I back to have a shot on target?”
There’s another equally important question.
Who is the market overestimating?
Over this particular sample, the distinction was enormous. Restricting ourselves to backing players would have turned a profitable weekend into a losing one.
That doesn’t mean backing value is inherently worse than laying value. We certainly wouldn’t draw that conclusion from 419 bets.
It does demonstrate why we don’t begin with the assumption that we need to find something to back.
Yes. I would replace the entire “After 163 Bets, We Were £159 Down” section with this.
Profit and Loss Varied Dramatically by Match
Looking only at the final +£290.18 doesn’t show how differently the model performed across the six matches.
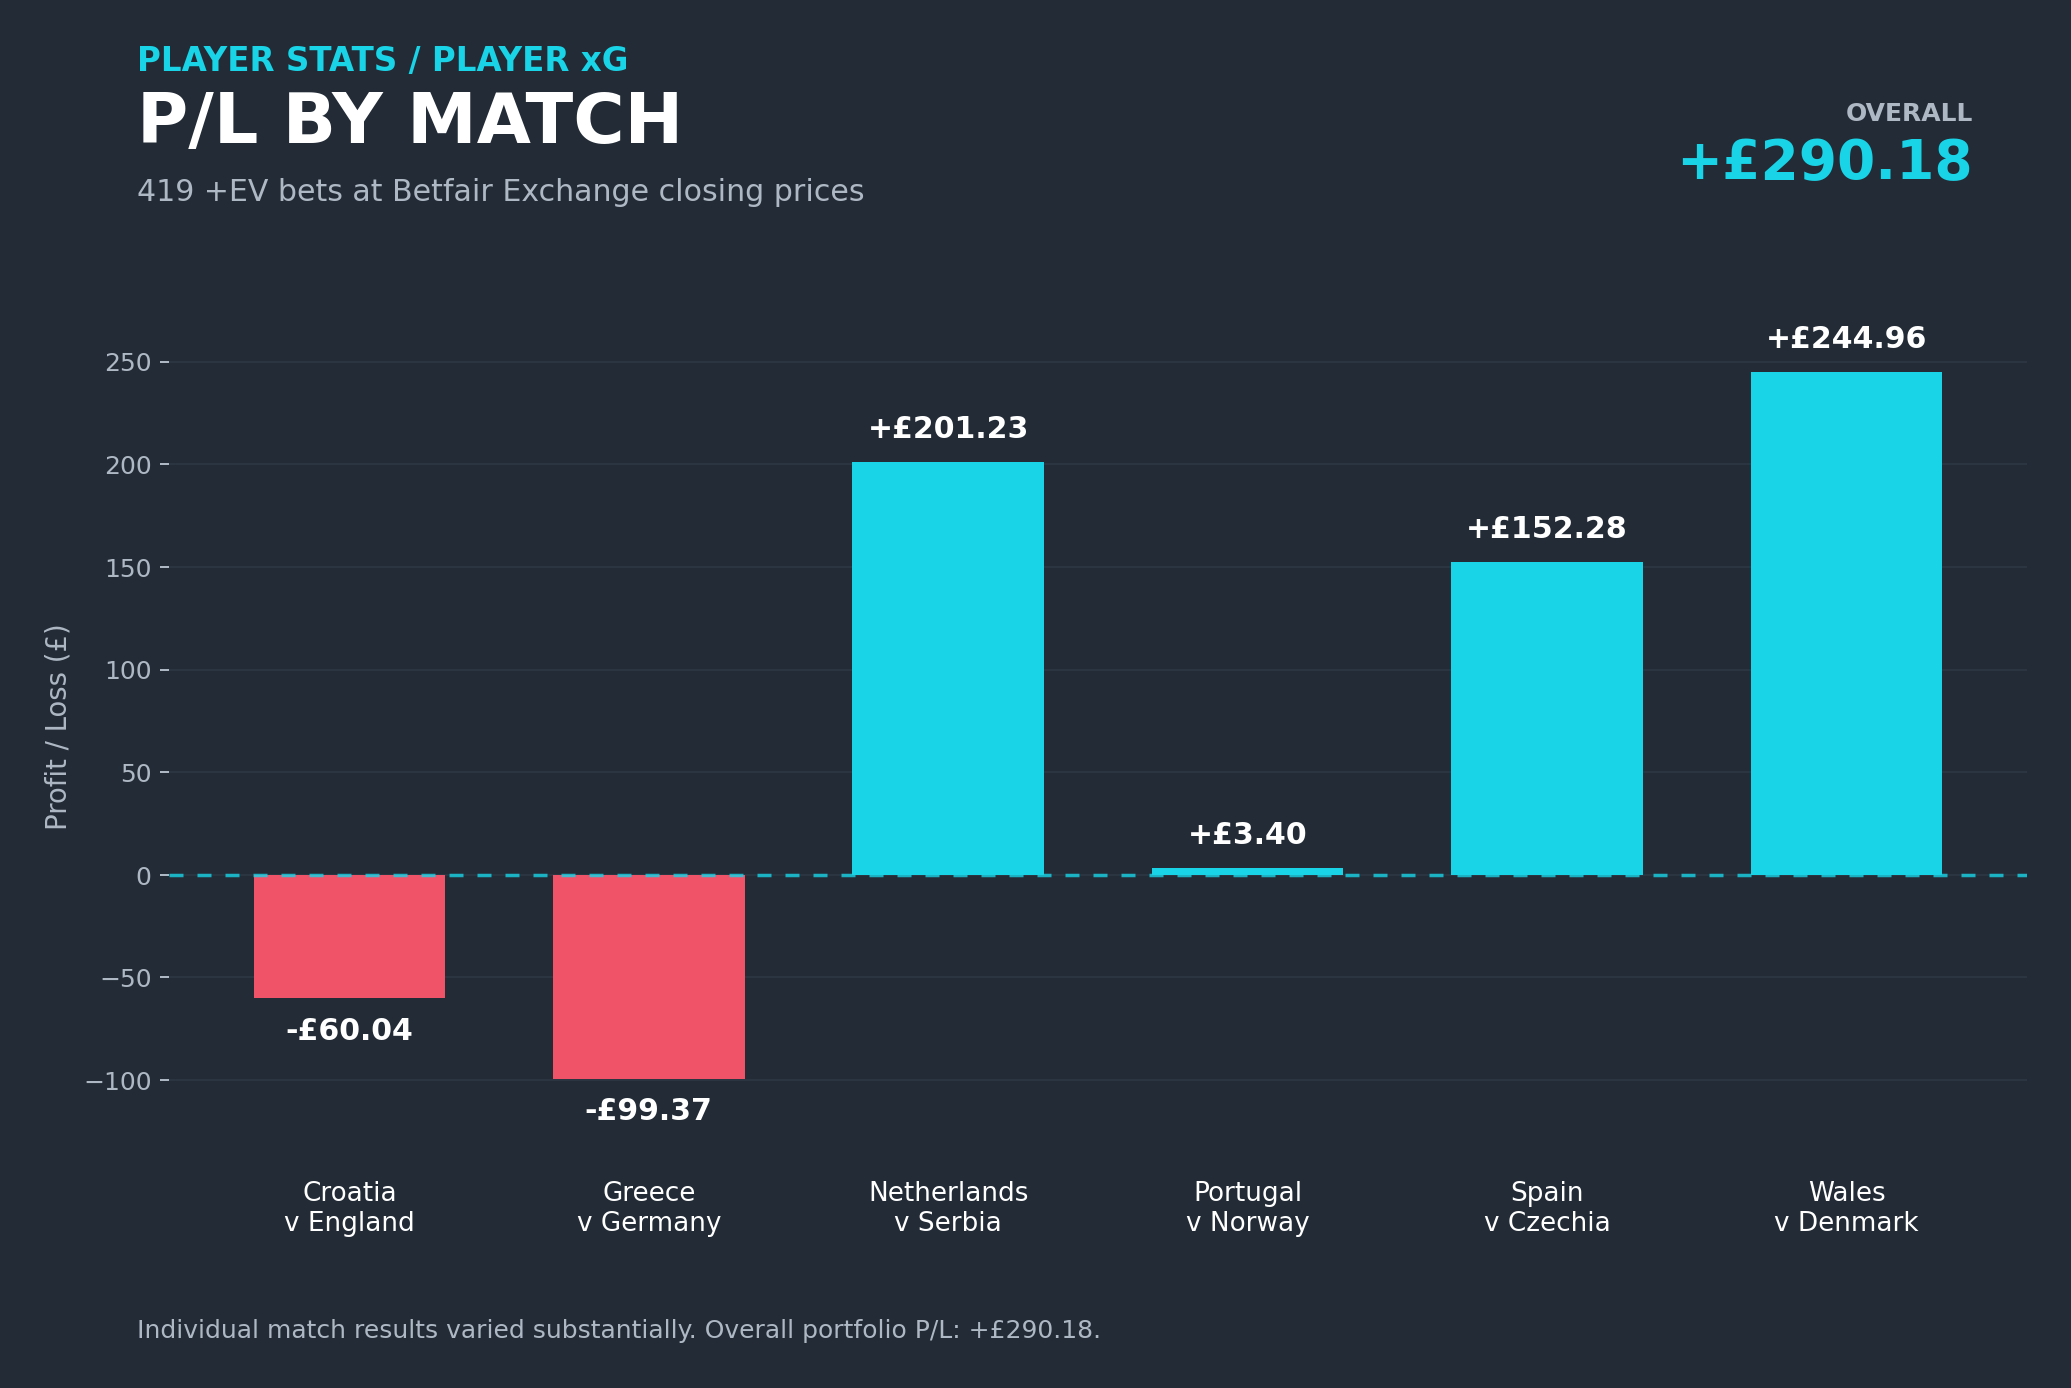
The results varied substantially from game to game. Croatia v England lost £60.04, while Greece v Germany lost £99.37. At the other end of the scale, Netherlands v Serbia produced £201.23 profit, Spain v Czechia made £152.28, and Wales v Denmark made £244.96. Portugal v Norway was almost flat at +£3.40.
That variation is important because several of these matches were being played at the same time. This wasn’t a case of suffering a losing match, changing something, and then recovering the money in the next game. The same model and the same approach were identifying value across all of them.
On Sunday in particular, Greece v Germany, Netherlands v Serbia, Portugal v Norway and Wales v Denmark were being played concurrently. One portfolio lost almost £100 while two others made more than £200 each.
That’s a useful illustration of why we don’t want to judge the model from one match, just as we don’t want to judge it from one bet.
A bettor concentrating on Greece v Germany could have come away thinking the model had performed terribly. Someone concentrating on Wales v Denmark could have reached exactly the opposite conclusion.
Neither tells us very much in isolation.
Across all 419 positions and all six matches, the result was +£290.18.
The purpose of pricing the whole market isn’t to be right in every match. It’s to repeatedly identify value across as many independent opportunities as possible.
One Market Had a Horrible Weekend
The overall profit also disguises an extremely poor performance from one particular market.
Our 1+ Shots on Target bets lost £166.81 at -12.32% ROI.
That is a terrible result.
Had somebody used only the BookieBashing 1+ SOT prices over these matches, they would understandably have had a pretty miserable weekend.
Other markets behaved very differently.
Anytime Goalscorer produced +6.95% ROI, First Goalscorer returned +6.72%, while player cards returned +6.07%.
Those three markets alone generated £464.84 of profit.
Again, this is why short-term results require context. One market can perform terribly while another performs extremely well. Neither necessarily tells us very much about the underlying quality of the prices from a relatively small number of bets.
Greece v Germany provides an extreme example of just how ugly variance can look.
There was a sequence of 15 SOT 1+ backs in that match and only one of them won.
These weren’t all marginal selections either.
We made Philipp Treu 4.19 for a shot on target and the Exchange offered 6.2. Vangelis Pavlidis was 1.61 fair and available at 1.8. Malick Thiaw was 3.80 fair and 4.5 on the Exchange. Alexandros Kyziridis was 2.17 fair and available at 2.74.
They all lost.
If you repeatedly back genuine 2.17 chances at 2.74, you want to keep making that bet regardless of whether the first one wins or loses.
The difficult part isn’t predicting whether that particular player will have a shot on target.
The difficult part is establishing whether 2.17 really is the correct fair price.
That’s the problem our modelling is designed to solve.
What Happens as the Modelled Edge Gets Bigger?
Another interesting way of looking at these results is to group selections according to their calculated EV before the match.
The results are fascinating.
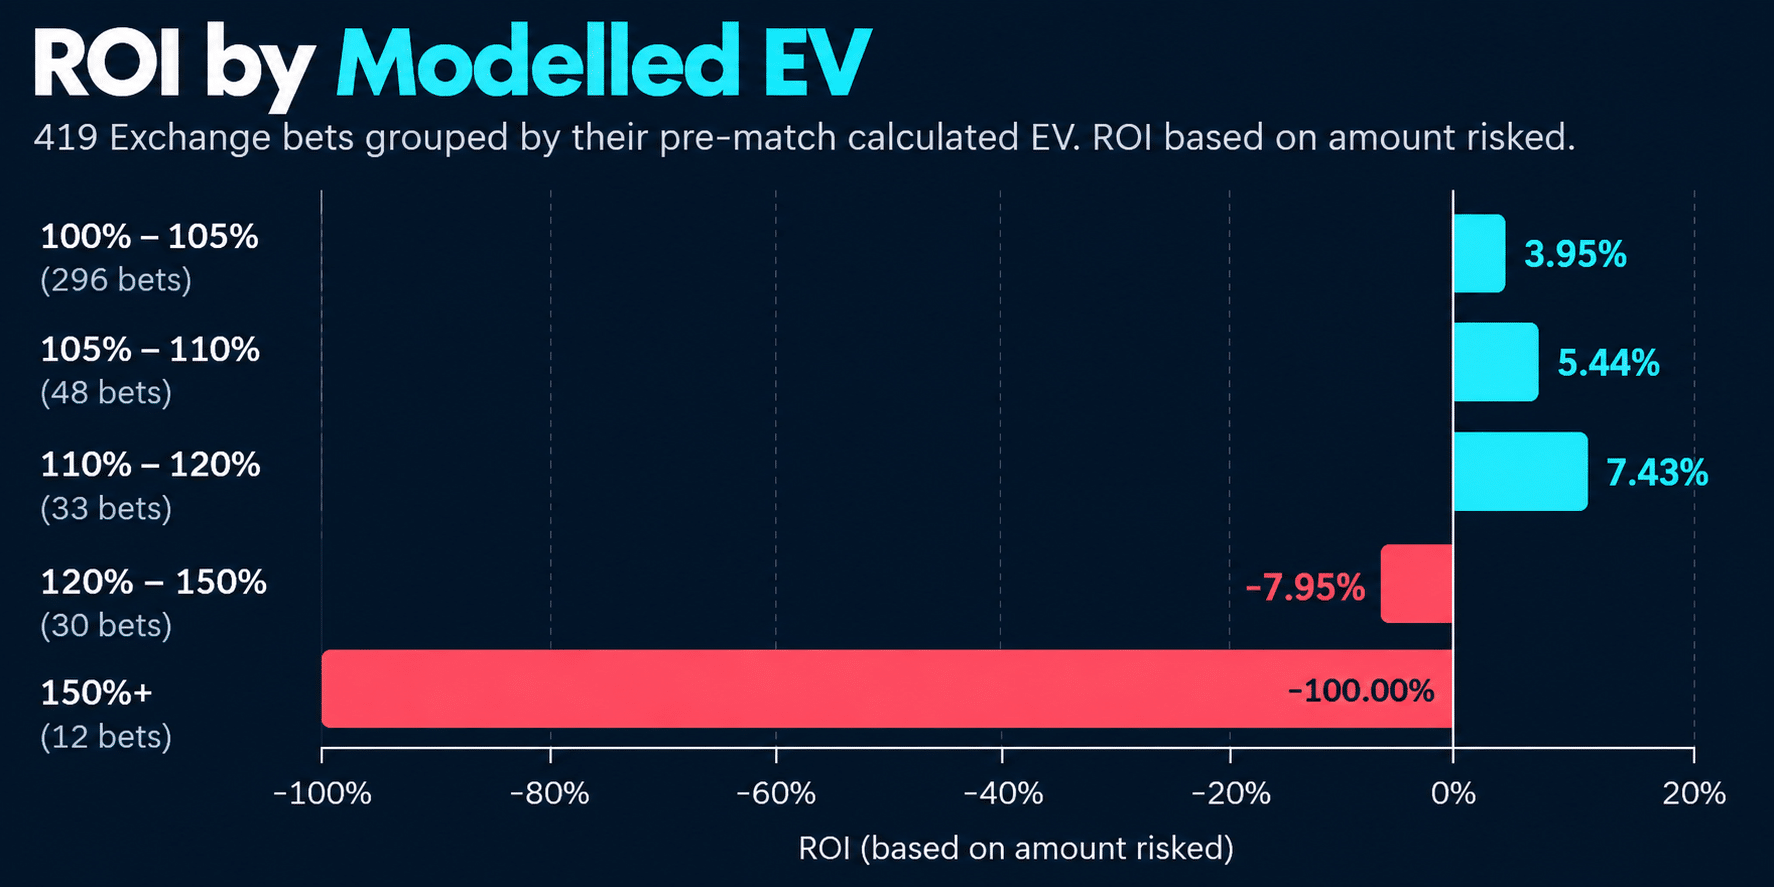
Among the 296 bets between 100% and 105% EV, the realised ROI was +3.95%.
For the 48 bets between 105% and 110% EV, it increased to +5.44%.
And among the 33 bets between 110% and 120% EV, realised ROI increased again to +7.43%.
That is exactly the sort of relationship we’d like to see.
But then something rather different happens.
The 30 bets between 120% and 150% EV returned -7.95%, while every one of the 12 selections above 150% EV lost.
Their realised ROI was -100%.
Does that mean our biggest calculated edges were actually our worst bets?
Not necessarily.
It demonstrates something much more important about sample size.
There were 377 bets in the first three groups combined, compared with just 12 in the 150%+ group.
Twelve bets tell us almost nothing about whether a probability model is properly calibrated.
Some of those losses also involved extraordinary differences between our prices and those available on the Exchange.
Dusan Tadic, for example, was available at 80.0 for 2+ shots on target when BookieBashing made the fair price 22.86.
He didn’t record 2+ shots on target.
The bet lost.
That doesn’t retrospectively make 80 a bad price.
It does provide an excellent demonstration of why even enormous theoretical edges don’t guarantee that the next bet wins.
Spain v Czechia: A Perfect Example of EV Versus Outcome
Spain v Czechia provides both sides of this argument within the same match.
We priced Adam Hlozek at 2.49 for 1+ SOT.
The Exchange offered 3.5.
He recorded a shot on target and the bet made £96.73.
Great bet. Great result.
But the same match contained several other substantial discrepancies.
Ladislav Krejci was 5.97 fair and 9.4 on the Exchange. Lukas Ambros was 3.58 fair and 6.4. Matej Radosta was 3.96 fair and 6.4.
Then there was Michal Sacek.
BookieBashing made his 1+ SOT fair price 6.88.
The Exchange offered 14.5.
That’s a huge apparent edge.
He didn’t have a shot on target.
The bet lost.
If we judged our model using outcomes, we’d presumably have to conclude that the Hlozek model was excellent and the Sacek model was terrible.
Of course, they came from the same modelling process.
Across the entire Spain v Czechia portfolio, BookieBashing eventually finished +£152.28 at +8.70% ROI.
That’s a much more useful level at which to begin evaluating performance.
Winning Doesn’t Make a Bet Good
This distinction sounds obvious, but it’s probably one of the hardest concepts in betting to internalise.
Suppose our model makes something 6.88 fair and you can back it at 14.5.
If our 6.88 is genuinely well calibrated, that’s an exceptional bet.
If it subsequently loses, it doesn’t become a bad bet.
Equally, laying Saka’s 2+ goals at 32.0 when our model made him 86.36 doesn’t suddenly become a terrible price because Saka happened to score twice.
If we could repeatedly lay genuine 86.36 chances at 32.0, we’d want to make that trade again and again.
The outcome of the next bet is largely irrelevant to that decision.
The critical question is whether our estimate of 86.36 is accurate.
How Should You Judge Our Lines?
Certainly not by finding the biggest loser from a weekend and asking how the model could possibly have got it so wrong.
Equally, we shouldn’t point to Adam Hlozek winning at 3.5 when we made him 2.49 and claim that one result proves the model works.
Both are examples of outcome bias.
We need to evaluate large numbers of prices.
We need to look at whether our probabilities are properly calibrated, whether performance persists across markets and, when our fair odds disagree with the Exchange, what happens when those differences are systematically bet over a meaningful sample.
That’s also why we archive results rather than simply selecting a few favourable examples after the event.
The Bigger Picture
This wasn’t a weekend where everything went right.
England’s 7-0 victory was painful for a model that had identified numerous lays. The entire 1+ SOT portfolio lost 12.32%. Our 153 back selections collectively lost money. At one point, after 163 bets, the running result was approximately £159 down.
Yet after all 419 +EV positions, the portfolio finished +£290.18 at +2.11% ROI.
More interestingly, the 266 lays produced +£455.38 at +3.69% ROI.
That is much closer to how we think betting models should be evaluated.
The question isn’t:
“Did Saka score twice?”
It’s:
“If we repeatedly take the prices our model identifies as value, what happens across the entire market?”
Because the edge isn’t one bet.
The edge is the process repeated across hundreds of them.